Tuesday, September 27, 2016

High-Income ZIP Codes Benefit Most from Housing Recovery

by Alexander Hermann
Research Assistant
Although home prices nationally have been on the upswing since early 2012, the increases have not only been uneven across metropolitan areas but are more likely to have occurred in the most affluent parts of each metropolitan area, according to a new Joint Center analysis of Zillow home value data.

Most notably, home values in high-income ZIP Codes that are home to their region’s more affluent residents are now about 1 percent higher than their post-2005 peak, while values in low-income ZIP Codes—which increased dramatically in the early 2000s—are still about 12 percent below their pre-recession peak. Moreover, home values in moderate-income ZIP Codes are still about six percent below their pre-recession peak (Figure 1). (In this analysis, low, moderate, and high-income ZIP Codes have a median household income less than 80 percent, between 80 and 120 percent, and above 120 percent of the state median income, respectively.)

Source: JCHS tabulations of Zillow Home Value Index data and ACS 2014 5-year data.

Moreover, home prices in low-income ZIP Codes are lagging both in recovered metropolitan areas as well as in metros yet to regain their peak price. Specifically, in recovered metros, 83 percent of high-income and only 65 percent of low-income ZIP Codes had median home values matching or exceeding their peak, a full 18-point difference. In metro areas within 15 percent of peak, but still below, 22 percent of high-income ZIP Codes have recovered relative to 9 percent of low-income ZIP Codes. In metropolitan areas furthest from peak—by one measure, those that remain hardest hit—only a sliver of low-income ZIPs (5 of 699) have recovered, compared with 37 of 899 high-income ZIP Codes (4 percent). In total, across the nation, 37 percent of high-income ZIP Codes have recovered, versus only 23 percent of low-income ZIP Codes (Figure 2).

Source: JCHS tabulations of Zillow Home Value Index data and ACS 2014 5-year data.

Extending the analysis to 2000 demonstrates why high-income ZIP Codes have been more likely to recover. Low-income ZIP Code home values increased tremendously during the housing boom, but a similarly harsh decline has made recovery more difficult, and has significantly weakened low-income ZIP Code home value gains since 2000 relative to high-income ZIPs. At peak, the median home value in low-income ZIP Codes more than doubled (increasing 101 percent) from January 2000 (Figure 3). The peak median value in high-income ZIP Codes increased only 82 percent. However, the post-recession decline wiped out a large share of the relative gains low-income ZIP Codes had made. In these ZIPs, median home values (as a percent of the January 2000 home value) dropped nearly 65 percent. In high-income ZIP Codes, the drop was 38 points. This precipitous decline, and a lagging recovery, have given high-income ZIPs a narrow edge in median home value increases overall. As of June 2016, median home values in high and low-income ZIPs were 84 and 76 percent, respectively, above their 2000 median home value.

Source: JCHS tabulations of Zillow Home Value Index data and ACS 2014 5-year data.

The overall trend varies somewhat when breaking ZIP Codes down into recovered and unrecovered metros. In recovered metros, median home value gains in high-income ZIP Codes have steadily outpaced those in low-income metros over time, sharply accelerating during the recovery (Figure 4). In unrecovered metros (which include nearly 70 percent of ZIP Codes in our sample), home values in low and high-income ZIP Codes have drawn about even in the long run (Figure 5). Figure 5 also shows that the metros worse off relative to past peaks are those where low-income ZIPs saw substantial home value gains relative to their initial home value and large declines during the recession. In these unrecovered metros, ZIP Codes in both categories have median home values about 79 percent above their 2000 values.

Source: JCHS tabulations of Zillow Home Value Index data and ACS 2014 5-year data.

Note: Percentage growth derived from nominal dollars.
Source: JCHS tabulations of Zillow Home Value Index data and ACS 2014 5-year data.

In an upcoming post, we’ll take a closer look one US metro that illustrates the uneven price recovery within its own ZIP Codes – San Francisco.

Friday, September 23, 2016

Metro Data on Rental Cost Burdens Show Uneven Improvement

by Alexander Hermann
Research Assistant
The national trend in cost burdens is reflected across most metropolitan areas of the US. Looking at the 100 largest Metropolitan Statistical Areas (MSAs) by population that have not undergone geographic boundary changes between 2005 and 2015, shows that in most metros, cost burden rates declined modestly for renters in 2015, but were still high relative to their levels in 2005. (A household is defined as cost-burdened when it spends more than 30 percent of its income on housing.)

Looking at cost burden rates among the top metros as a group, we find the number of metro areas with exceedingly high cost burden rates declined in 2015. Indeed, the number of metros where cost burdens affect at least half of all renters declined from 44 metros in 2014 to 33 in 2015, which is a significant improvement from 2010 levels, when cost burdens affected half of all renters in 65 metros. In total, between 2010 and 2015, fully 83 metros saw declines in the share of cost burdened renters.

Even with these improvements, however, the share of cost-burdened renters is still above 2005 levels in most metros. More than half of rental households were cost-burdened in 33 metros in 2015, an increase of 11 metros from 2005 (Figure 1). Moreover, renter cost burden rates in 66 metros were higher in 2015 than they were in 2005.

Source: JCHS tabulations of US Census Bureau, 1-Year American Community Survey estimates via Factfinder.

This trend is also evident for the more extreme measure of severe cost burdens (those paying more than 50 percent of income for housing). From 2014 to 2015, the number of metros with severe renter cost burden rates of 25 percent or more declined from 63 to 49 of the top 100 metros, respectively (Figure 2). This is a big improvement from 2010, when 79 metros had such high rates of severely cost-burdened renters, but still worse than in 2005, when it was just 37 metros.

Source: JCHS tabulations of US Census Bureau, 1-Year American Community Survey estimates via Factfinder.

Indeed, despite significant near-term improvement, severe cost burdens have yet to return to 2005 levels in most metros. In the 100 largest metros for which data extends back to 2005, 60 had larger shares of severely cost-burdened renters 2015 than in 2005.

Lastly, initial analysis finds that the 2015 data also show the profile of metros with the highest burden rates appears to have shifted somewhat. In 2015, metros with the highest shares of severely cost-burdened renters are generally the large metros with tight housing markets along both coasts, including New York, Miami, and Honolulu. In 2005, the profile of metros with this high share of severe cost burdens was different; though some coastal metros were included (like Miami and Stockton, CA), midwest and declining industrial metros were more prevalent among the severely cost-burdened metros (including Cleveland, Detroit, Rochester, and Memphis).


We’ll post additional analysis on this dataset in the coming weeks and months.

See the full metro Excel table for a complete set of metro-level cost burden data for 2015.

Thursday, September 22, 2016

New Data Shows US Renter Cost Burdens Easing, But Still Elevated

by Dan McCue
Senior Research
Associate
The number of renters paying 30 percent or more of their income on housing decreased in 2015 by 240,000 households, reversing an eight-year trend of annual increases in the number of “cost-burdened” renters, according to new data released last week by the US Census Bureau. Unfortunately, however, the decrease was very modest in comparison to previous years. Indeed, the decrease in rent-burdened households recorded in 2015 was less than half the increase recorded in 2014. Moreover, the data show that there still are 21.4 million “cost-burdened” renters in 2015, 1.15 million more than in 2010 and fully 4.0 million more than in 2005 (Figure 1).

 Click to enlarge
Source: JCHS tabulations of US Census Bureau, 2015 1-Year American Community Survey estimates via FactFinder

The data also show some improvement in the number and share of “severely burdened” renters (those paying 50 percent or more of their income on rent). However, this growth was not enough to return to the pre-recession levels of 2008 and earlier. Overall, the number of renters paying 50 percent or more on rents decreased from 11.50 million to 11.28 million in 2014–2015, which was the lowest number since 2010. The share of renters with severe burdens dropped from 26.6 percent of all renters in 2014 to 25.8 percent in 2015. This is the lowest rate recorded since 2008, when 25.0 percent of renters paid 50 percent or more of incomes on housing.

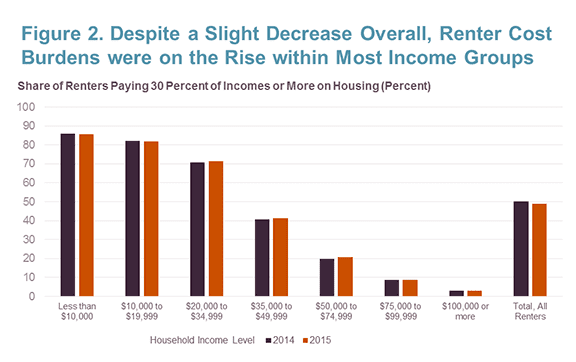
In addition, the decline in the overall number of cost-burdened renter households in 2015 masked some worsening of cost burden rates within many income groups (Figure 2). Among people earning $20,000-to-$34,999 annually (which in many areas is still a low and/or moderate income), the share of those who were cost-burdened rose from 70.8 percent in 2014 to 71.3 percent in 2015. While a much smaller share of renters making more than $35,000 a year are cost-burdened, there were modest (less than one-percentage point) increases in the share of cost-burdened households, for these renters as well. In comparison, while more than 80 percent of the renters who make less than $20,000 a year are cost-burdened, that figure fell by less than one percent between 2014 and 2015.

 Click to enlarge
Source: JCHS tabulations of US Census Bureau, 2014 and 2015 1-Year ACS data.

Taken together, these shifts suggest that the overall decline in cost-burden rates for renters is due to growth in the number of renters with higher incomes and a decline in the number of low-income renters. While this could be viewed as a positive trend for renter households as a group, the fact that renter burden rates continue to grow within and among higher income groups suggests affordability problems are growing across the income spectrum and even for higher income groups.

Tomorrow, we’ll take a closer look at the improvement trends across various metropolitan areas.

Tuesday, September 20, 2016

Developing a “New Urban Agenda” in Paraguay

by David Luberoff
Senior Associate Director
Since urban growth has come relatively late to Paraguay, the South American country has had the opportunity learn from the successes and failures of others, noted Maria Soledad Núñez, Paraguay’s Minister of Housing and Habitat in a Brown Bag talk hosted by the Joint Center for Housing Studies at Harvard’s Graduate School of Design on September 12.

The youngest person ever appointed a Cabinet-level minister in Paraguay, Núñez, who was appointed in 2014, when she was 31 years old, recalled that accepting the post represented a major change for her, as she had spent almost a decade working at NGOs that advocated on behalf of those living in slums in her country and other parts of Latin America. Although she worried about whether she would be given the authority to move forward with the ambitious policies she had been advocating, she ultimately decided that the opportunity was too promising to pass up.  


At her talk, which was co-sponsored by the Harvard Urban Planning Organization, Núñez recalled how, when she became minister, she pressed for a dramatic increase in the production of social housing for low-income families. At the time, the Ministry had been building less than 2,000 units a year and most observers didn’t think it had the capacity to even double that amount. Now, however, the Ministry is building more than 10,000 housing units a year. Núñez is also trying to build on that success by focusing not only on building new housing but also ensuring that the new units are part of larger plans to implement the country’s New Urban Agenda, which seeks to create viable and vibrant communities.

As part of those efforts, Núñez added, the Ministry is working with the local government of Asuncion, the capital and Paraguay’s largest city, to relocate low-income residents living in areas regularly subject to flooding from the Rio Paraguay to better housing and to transform some of those areas into badly needed open space for the city’s residents. She also is leading the country’s National Committee of Habitat, which comprises more than 50 public and private institutions that are working together to carry out the country’s urban plans.

Download Minister Núñez’s presentation
(Source: SENAVITAT, National Secretariat of Housing and Habitat of Paraguay)

Wednesday, September 14, 2016

New Census Data on Incomes Suggests Growing Demand for Housing

Dan McCue
Senior Research Associate
New data released by the Census Bureau on Tuesday suggests that the demand for housing – particularly among young adults – may be growing.

As many news outlets have reported, the CPS 2016 Annual Social and Economic Supplement with household income data for 2015  showed that real median household income rose 5.2 percent from 2014 to 2015, to $56,516. It was the first annual increase in median household income since 2007. Median household incomes were up for each region of the country, and for non-Hispanic white, black, and Hispanic households, and across all age groups (Figure 1).

 Click to enlarge
Source: JCHS tabulations of US Census Bureau, Current Population Survey Annual Social and Economic Supplements

The data release also showed significant increase in real median earnings at the person level in 2015, which grew 5.0 percent for all adults over age 15. Incomes were up most sharply among younger adult age groups under the age of 40 (Figure 2).

 Click to enlarge
Source: JCHS tabulations of US Census Bureau, Current Population Survey Annual Social and Economic Supplements

For several reasons, this growth is likely to have significant implications for housing markets. First, at the individual level, higher incomes increase demand for housing. For young adults, housing independence is closely linked to income. Those with higher incomes are more likely to be able to rent their own apartment. Analyses in the Joint Center’s 2016 State of the Nation’s Housing report describe this, adding that nearly half of the decline in household formation among young adults aged 25-34 across the Great Recession was due to declines in income suffered by people in this age group. Income growth can therefore work in the reverse, helping enable young adults to move out of their parents’ basement and into their own home.

At the household level, income growth also increases housing demand, particularly for homeownership. As higher income households are more likely to own homes, increases in incomes among households will work against the continued decline in the US homeownership rate. In terms of affordability, the strong association between household income and housing cost burdens also means income growth may help alleviate some people who are stressed with housing costs, but on the affordability front there is still a long way to go.

Finally, it is worth noting that the Current Population Survey Annual Supplement is a relatively small survey with a high degree of annual volatility year to year, so the exact movements of household income and personal earnings measured year to year should be viewed with the wide margin of error they require. That said, the income growth reported in the latest survey is still a good sign that improvement in jobs and the economy is now translating into increased earnings that is likely to lead to growth in households and greater demand for housing.

Monday, September 12, 2016

As Baby Boomers Age, Older Single Women Will Face the Greatest Housing Challenges

Shannon Rieger
Research Assistant
While high-quality, age-friendly, affordable housing will be a critical need for all of America’s growing number of aging households, for two reasons, the needs of older single women require particular attention for policymakers, providers, and others.

First, because women generally outlive their male spouses or partners, they will continue to be a major share of all older households. Women living alone already comprise 44 percent of all households (and three-quarters of all single-person households) where the householder is age 80 or over (Figure 1). Such women—particularly women who rent rather than own their homes—are among those older people who are most at risk of housing, financial, and health insecurity as they age.

 Click to enlarge
Source: JCHS tabulations of 2014 American Community Survey data.

These challenges are one aspect of a larger demographic transformation that will occur over the next several decades as the aging of the baby boomer generation and increases in longevity swell the elderly American population. The US Census Bureau projects that the population aged 65 and over will reach 79 million by 2035, an increase of more than 30 million in just two decades (Figure 2). Further, longer life expectancy could nearly double the number of individuals aged 85 and over to 12 million by 2035.

 Click to enlarge
Source: US Census Bureau 2015 Population Estimates and 2014 National Population Projections.

This so-called “Silver Tsunami” has already begun to reshape housing needs across the nation, generating demand for accessible, affordable housing that can help older households age safely and comfortably in place. As people age, finding the resources to make age-friendly home modifications, to pay for assistance with daily activities and self-care, or even keep up with housing payments often becomes increasingly difficult. The risk of falling into financial and housing insecurity grows when households cross into their retirement years (age 65), as incomes begin to drop dramatically while out-of-pocket health care expenditures rise (Figure 3). While some households may be able to adequately supplement shrinking incomes with retirement savings, home equity, and other forms of wealth, a recent report from the Employee Benefit Research Institute shows that many households on the verge of retirement today have insufficient savings to independently finance their retirement years.

 Click to enlarge
Source: Median household income derived from JCHS analysis of 2014 American Community Survey Data. Out-of-pocket personal health care spending data derived from the Centers for Medicare and Medicaid Services’ National Health Expenditure Data, 2012 Age and Gender Tables.

Some aging households are particularly vulnerable to the consequences of financial insecurity and loss of independence. Older individuals who live by themselves, for example, often have neither the option to seek help with daily activities or unexpected emergencies from another person in the home, nor the financial cushion of a second income from a spouse or housemate. Women are disproportionately impacted. Older women, who are more likely to live alone in later life, continue to have lower lifetime earnings than their male peers, and are also more likely than men to need expensive long-term care. As a result, single women are projected to experience the largest retirement savings shortfalls over the next several decades.

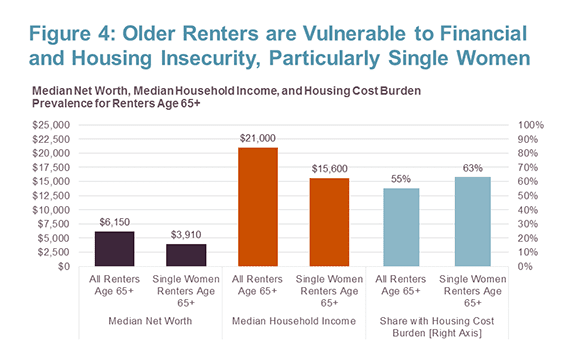
Single older women who rent rather than own their homes are most at risk of falling into housing and financial insecurity. Older renters lack housing equity and typically also have far lower overall net worth than older owners, leaving many unable to sufficiently bolster limited retirement incomes with financial reserves. Analysis of the most recent Survey of Consumer Finances data shows median net worth for renters age 65 and over to be just $6,150—a mere 2.4 percent of median net worth for owners of the same age. For single older women renters, median net worth is even lower—just $3,910—and the risk of financial insecurity is especially high, intensified by comparatively lower incomes and even higher housing cost burdens than older renters overall (Figure 4). In 2014, annual median income for single women renters age 65+ was just $15,600. Meanwhile, fully 63 percent had a housing cost burden, with 38 percent paying at least 50 percent of their income toward housing. This combination of high housing cost burdens, low incomes, and little net wealth mean that older single women renters have few resources left to pay for assistance with self-care and other needs. But with median annual costs for non-residential long-term care ranging from $17,680 for adult day health care to $45,760 for full-time homemaker services, formal care is far out of reach for many single older women. With the aging of the baby boomer generation poised to increase the number of single older women living alone to unprecedented proportions over the next several decades, finding ways to mitigate housing and financial instability among this most vulnerable group is fast becoming a critical need.

 Click to enlarge
Source: JCHS tabulations of 2013 Survey of Consumer Finances (SCF) and 2014 American Community Survey (ACS) data. Dollars are nominal.
Notes: "Moderate" burden is defined as housing costs of 30-50 percent of income. "Severe" burden is defined as housing costs of more than 50 percent of income. Due to survey design differences between SCF and ACS, "single women renters" refers to single-person female-headed households for data describing median household income and housing cost burdens, and to women whose marital status is "single" for data describing median net worth.

As previous Joint Center work has highlighted, our aging population will re-shape housing demand across the nation over the next several decades, greatly increasing the need for affordable, accessible, age-friendly housing. Ensuring that older single women, especially renters, have access to high-quality housing and home care will require particular attention, given their low incomes, low wealth, high likelihood of need for care, and the absence of a spouse, partner, or other household member able to provide daily assistance in the home. As the older population grows in coming years, it will be critical for policymakers and providers to take special care to ensure that our nation’s most vulnerable older households—particularly older single women—have access to tools that can help them age safely and successfully in their own homes and communities. Such tools may include affordable rental options and in-home care and homemaking services, as well as loan and grant assistance opportunities for age-friendly home modifications. Finding ways to expand access to these and other solutions will be critical to protecting the health, happiness, and well-being of our aging population today and in years to come.