
 |
| by Ellen Marya Research Assistant |
In conjunction with the release of our 2015 State of the Nation’s Housing Report, the Joint Center mapped
the prevalence of housing cost burdens – a key measure of housing affordability
– in the US’s 900 metropolitan and micropolitan areas. As the map series illustrates, the share of
households living in unaffordable housing varies dramatically across the
country and for both owners and renters. Housing cost burdens, defined as the
expenditure of more than 30 percent of household income on housing costs, are
less pervasive in the country’s interior, while higher burden rates are largely
concentrated in coastal and more urban areas and among renter households in
particular. But within these nationwide patterns, high burden rates reflect
unique local dynamics of household incomes and housing costs.
American Households Feel the Strain of Housing Cost Burdens
(click map to launch)
(click map to launch)

The relationship between cost burdens, incomes, and housing
costs within the 100 most populous metro areas is illustrated in Figure 1. As the figure shows,
while housing costs and household incomes tend to rise together, the trend in cost
burdens is somewhat less straightforward. Metro areas with lower cost burden
rates (less than 30 percent of households with cost burdens, shown in yellow) are
largely those with both low median housing costs and low to moderate median
household incomes. Metros with moderate cost burden rates (between 30 and 35
percent of households with cost burdens, shown in orange) are more likely to
have wider income distributions and slightly higher median housing costs, so
that housing affordability becomes more difficult for those at the lower end of
the income spectrum. This is even more striking in the group of metros with
high cost burden rates (35 percent or more of households with cost burdens,
shown in red), which includes several of the highest-income and highest cost metro
areas; in these, affordability challenges move up the income scale.
Figure 1 (move cursor over figure to access additional information)
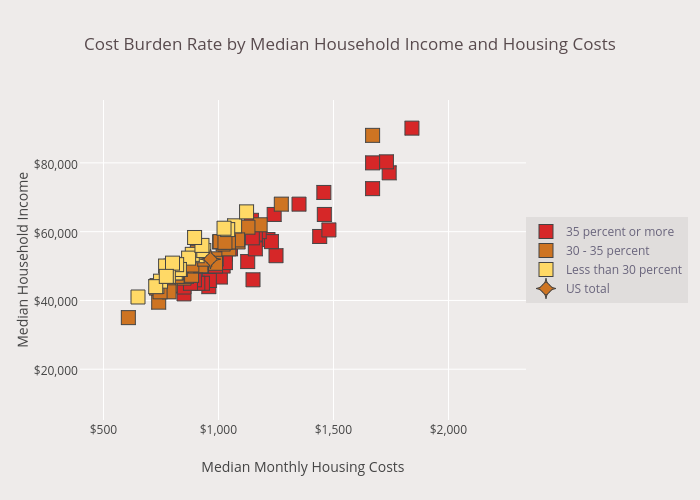
Notes: Housing cost burdens are defined as housing costs of more than 30% of household income. Households with zero or negative income are assumed to have burdens, while renters paying no cash rent are assumed to be without burdens. Source: JCHS tabulations of US Census Bureau, 2013 American Community Survey.Figure 1 (move cursor over figure to access additional information)
Indeed, cost burden rates among higher income groups rise dramatically as median housing costs rise (Figure 2). Among the large metro areas with the highest cost burden rates, the share of cost-burdened middle income households (with incomes between $30,000 and $45,000 annually) rises from just over one third in relatively low cost Tucson, to more than three quarters in high cost San Jose. A similar pattern holds among upper-middle and high income households, with cost burden rates topping 15 percent of high income households (earning more than $75,000 per year) in eight high cost metros.
Figure 2 (click on legend entry to display each income band)
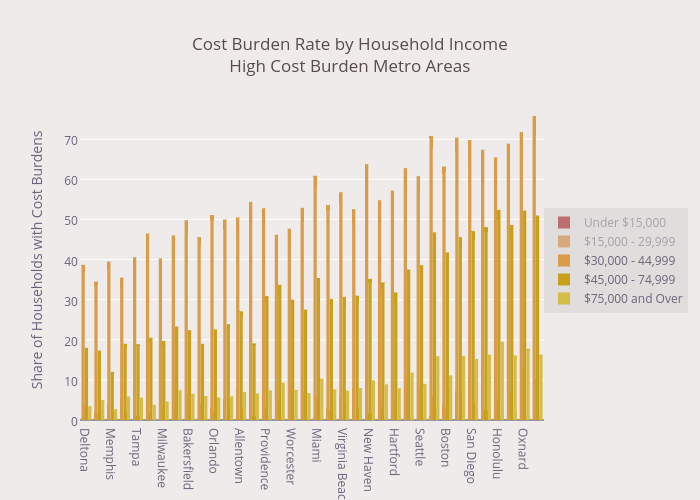
Notes: Housing cost burdens are defined as housing costs of more than 30% of household income. Households with zero or negative income are assumed to have burdens, while renters paying no cash rent are assumed to be without burdens. High cost burden metro areas have a metro-wide cost burden rate of 35 percent or more. Metro areas are ordered from lowest to highest median monthly housing costs. Source: JCHS tabulations of US Census Bureau, 2013 American Community Survey.
The immense challenge faced by low-income households in
finding affordable housing has been intensively detailed in a number of other
analyses. In its annual Out of Reach
report, the National Low Income Housing Coalition concludes that a full-time
minimum wage worker cannot afford to rent a one- or two-bedroom apartment at
Fair Market Rent in any state in the country, while the Urban Institute has mapped the growing shortage of units adequate, affordable,
and available to lowest income renters in counties nationwide. As each of these
inquiries shows, housing affordability remains a compelling need for the
nation’s lowest income households.
No comments:
Post a Comment