 |
| by Dan McCue Senior Research Associate |
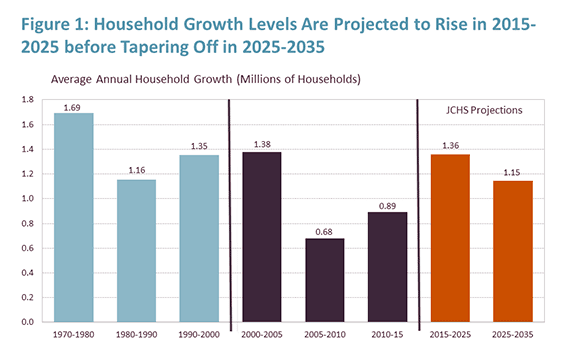
Sources: JCHS Tabulations of US Census Bureau, Housing Vacancy Surveys, Decennial Censuses, and 2016 JCHS Household Projections
While both changes are significant, the increases from our 2013 household projections are due entirely to the new Census Bureau population projections. In contrast, the methodological changes produce slightly lower projected growth than our previous methodology. However, the methodological changes do affect the distribution of household growth by age, race and ethnicity. In particular, they increase household growth among the oldest age groups and also among non-Hispanic whites between 2015 and 2025. In contrast, they reduce growth among 25-44 year olds as well as from black and Hispanic households.
Despite these shifts, millennials and minority households are still projected to be the main drivers of household growth in coming decades. Indeed, millennials under age of 30 in 2015 are projected to form 23 million net new households between 2015 and 2025, while 72 percent of household growth overall is expected to be non-white households. At the same time, aging of the baby boom generation will bring the number of senior households up to unprecedented heights (Figure 2). Together these forces will reshape housing demand over the next two decades.
Source: 2016 JCHS Household Projections
In addition to the estimates on household growth, the working paper includes an addendum with baseline estimates for the amount of new residential construction that might be needed to accommodate future household growth, as well as the demand for replacement units, second homes, and other changes. Combined, these factors suggest that the baseline demand for new housing units between 2015 and 2025 will range from 16.0 to 18.2 million units. While this estimate is well above most recent rates of new unit completions and mobile home placements, it is consistent with historic averages for past 10-year periods (Figure 3). Although the analysis does not factor in estimates of over- or under- supply, the estimates do suggest underlying demand will support higher construction levels and that the growth in residential construction seen over the past five years is likely to continue.
Source: JCHS Tabulations of US Census Bureau, New Residential Construction data


In looking at your household estimates by age group (from the spreadsheet), I was struck by the differences between your 2010 estimates and those from decennial census 2010. as shown below. Census 2010 JCHS 2010 (thousands)
ReplyDelete15-24 5401 6754
25-34 17957 18771
35-44 21291 21980
45-54 24908 24825
55-64 21340 21178
65-74 13505 13517
75+ 12315 11861
Any feel for why your household estimates for young adults aren't even close to what the decennial Census showed?
Tom Lawler, LEHC
As noted in the methodology section of the full paper, historical household estimates for years 1994-2015 are based on the Census Bureau’s annual CPS/ASEC surveys.
DeleteAs for why the estimate differs from the decennial Census estimate in 2010, the JCHS published a paper in 2015 that provides an assessment of the differences in household counts in the major Census Bureau surveys and explains why we think the use of the CPS in our household projection methodology is appropriate. That paper can be found at the following link:
http://www.jchs.harvard.edu/research/publications/assessing-households-and-household-growth-estimates-census-bureau-surveys
I, of course, read that assessment, but that assessment ignored (1) huge differences between the CPS/ASEC and the decennial Census with regards to households by age; and (2) huge differences between he CPS/ASEC in terms of housing tenure both in aggregate and by age (the latter of which is astonishingly large). In fact, a close look at the CPS/ASEC vs. the decennial Census strongly suggests that the CPS/ASEC is a very poor indicator either of young adult household totals or (even more so) young adult homeowner totals. I'd be more than happy to share the data showing the issues with the CPS/ASEC, though I'm sure you have them already.
DeleteTom Lawler, LEHC
Obviously, the decennial Census household numbers are the best place to start for 2010. Y'all have a lot of work to do.
DeleteTom Lawler, LEHC
As you know, the CPS/ASEC estimates with respect to age of householder and tenure were vastly different from Decennial Census results. The differences for young adults were astounding large.
ReplyDelete