Showing posts with label repair. Show all posts

Thursday, April 19, 2018

Home Remodeling Expected to Remain Strong and Steady into 2019

by Abbe Will
Associate Project Director,
Remodeling Futures
The robust pace of spending on home renovations and repairs is expected to stay strong over the coming quarters, according to our latest Leading Indicator of Remodeling Activity (LIRA). The LIRA projects that annual growth in homeowner remodeling expenditure will remain above 7 percent throughout the year and into the first quarter of 2019.

Strengthening employment conditions and rising home values are encouraging homeowners to make greater investments in their homes. Upward trends in retail sales of building materials and the growing number of remodeling permits indicate that homeowners are doing more—and larger—improvement projects.

While the overall outlook is positive, one area of concern is the slowing growth in sales of existing homes, since sales traditionally trigger significant renovation spending by both sellers and buyers. Even with this headwind, annual spending on residential improvements and repairs by homeowners is set to exceed $340 billion by early next year.


For more information about the LIRA, including how it is calculated, visit the JCHS website.

Thursday, January 18, 2018

Remodeling Market to March Higher in 2018

by Abbe Will
Research Associate
The coming year is expected to be another robust one for residential renovations and repairs with growth accelerating as the year progresses, according to our latest Leading Indicator of Remodeling Activity (LIRA). The LIRA projects that homeowner spending on improvements and repairs will approach $340 billion in 2018, an increase of 7.5 percent from estimated 2017 spending.

Steady gains in the broader economy, and in home sales and prices, are supporting growing demand for home improvements. We expect the remodeling market will also get a boost this year from ongoing restoration efforts in many areas of the country impacted by last year’s record-setting natural disasters.

Despite continuing challenges of low for-sale housing inventories and contractor labor availability, 2018 could post the strongest gains for home remodeling in more than a decadeAnnual growth rates have not exceeded 6.8 percent since early 2007, before the Great Recession hit.

For more information about the LIRA, including how it is calculated, visit the JCHS website.

Thursday, November 30, 2017

Rebuilding from 2017's Natural Disasters: When, For What, and How Much?

by Kermit Baker and
Alexander Hermann
The bulk of repairs to homes damaged by this year's record-setting disasters will not be done until 2019 or 2020, according to our analysis of post-disaster spending between 1994 and 2015. The analysis, which looked at the estimated annual cost of natural disasters alongside annual estimates of disaster-related home repairs and improvements, suggests that an increase of $10 billion in total disaster losses any time in the previous three years is associated with about $300 million in additional annual spending on disaster-related home repairs and improvements.

Notes: Dollar values are adjusted for inflation using the CPI-U for all items. Natural disaster costs include only natural disasters that generate over $1 billion in damages after adjusting for inflation.
Sources: JCHS tabulation of US Housing and Urban Development, American Housing Survey, and National Oceanic and Atmospheric Administration data.


The finding is significant because 2017 was an unusually destructive year. While inflation-adjusted, disaster-related damages averaged about $40 billion a year between 1994 and 2015, Hurricanes Harvey, Irma, and Maria together caused about $150 billion in damages, according to estimates from CoreLogic and Moody’s Analytics (Figure 1). Moreover, damages from 2017’s winter storms, droughts, and wildfires will push these numbers even higher. In fact, the total cost of 2017’s disasters could exceed damages from any year in the last two decades, including 2005, the previous record year, when Hurricanes Katrina and Rita (and a host of smaller but significant disasters) combined to cause more than $200 billion in damages (in inflation-adjusted dollars).

As in other years that were marked by particularly destructive storms and other disasters, this year’s damages should lead to a spurt in construction activity. Some of it will be construction of and renovations to infrastructure and commercial buildings. Some will be the construction of new single-family homes and multifamily housing units. And some will be disaster-related repairs and improvements to both owner-occupied and rental housing.

Extensive flooding from Hurricane Harvey in Port Arthur, Texas.

To estimate how much will be spent on post-disaster home repairs, and when that spending is likely to occur, we combined information on disaster-related damages reported by the National Oceanic and Atmospheric Administration (NOAA) with data on disaster-related home repairs and improvements for the same years found in the U.S. Census Bureau’s American Housing Survey (AHS). The AHS, as a survey of households, only asks owners to report spending on their homes. The comparison suggests that renovation spending continues to increase for about two to three years after the natural disaster occurs, and that an increase of $10 billion in disaster losses any time over the prior three years generates about $300 million in additional disaster-related home improvement spending during the year studied. If this pattern holds, the bulk of the spending from 2017 losses won’t occur until 2019 or 2020. But when it occurs, there is likely to be a substantial increase in spending on home renovations in those years.

While the delay between disaster losses and repair expenditures may seem unusually lengthy, it is consistent with a study funded by the U.S. Department of Housing and Urban Development (HUD) that examined the rebuilding that took place following Hurricanes Katrina and Rita. In a recent Joint Center blog on that study’s implications, our colleague Jonathan Spader (who worked on the initial HUD study) reported that only 70 percent of hurricane-damaged properties in Louisiana and Mississippi had been rebuilt by early 2010, five years after the storms. The study further found that 74 percent of owner-occupied homes had been rebuilt, compared to only 60 percent of the rental properties.

The delays are due to many factors. Insurance companies need to assess the extent of the damage and determine how much is covered. Home improvement contractors, stretched to the limit and suffering from a labor squeeze, must delay certain projects. Owners have to consider local housing and labor market conditions to determine if repairs or improvements make financial sense. Often, federal, state, and local government entities may slow down rebuilding while they decide whether it’s feasible and, if so, whether building codes and insurance guidelines should be more stringent.

Nevertheless, spending will occur and, when it does, it can be substantial. Illustratively, in 2015 (which came after a few relatively mild years for disasters) spending on disaster-related home renovations accounted for almost $11 billion of the $220 billion spent nationally improving owner-occupied homes according to the 2015 AHS. (Lightning and fires accounted for $2.4 billion of this spending, floods for $2.0 billion, and tornados and hurricanes for $1.6 billion. Winter storms, thunderstorms, earthquakes, and drought accounted for the remainder.)

In short, 2017’s hurricanes and other disasters are likely to result in substantial spending on rebuilding, repairs, and improvements to disaster-damaged homes. Moreover, while that spending will ramp up slowly, it is likely to stretch into next decade.

Thursday, July 20, 2017

Steady Gains in Remodeling Activity Moving into 2018

by Abbe Will
Research Associate
Healthy and stable growth in home improvement and repair spending is anticipated for the remainder of the year and into the first half of 2018, according to our latest Leading Indicator of Remodeling Activity (LIRA), released today. The LIRA projects that annual increases in remodeling expenditures will soften somewhat moving forward, but still remain at or above 6.0 percent through the second quarter of 2018.

The remodeling market continues to benefit from a stronger housing market and, in particular, solid gains in house prices, which are encouraging owners to make larger investments in their homes. Yet, weak gains in home sales activity due to tight inventories in many parts of the country is constraining opportunities for more robust remodeling growth given that significant investments often occur around the time of a sale.

Even with some easing this year, the remodeling market is still expected to grow above its long-term averageOver the coming 12 months, national spending on improvements and repairs to the owner-occupied housing stock is projected to reach fully $324 billion.


For more information about the LIRA, including how it is calculated, visit the JCHS website.

Thursday, January 19, 2017

New Benchmark Data Modestly Lowers Remodeling Market Size Projections

by Abbe Will
Research Analyst
The Joint Center’s Leading Indicator of Remodeling Activity (LIRA) provides a short-term outlook of national home improvement and repair spending to owner-occupied homes and is benchmarked to national spending estimates from the Department of Housing and Urban Development’s American Housing Survey (AHS). The latest LIRA release projects national spending for home remodeling and repairs will grow to $317 billion in 2017, an increase of 6.7 percent from last year. This LIRA release also updates and revises historical spending levels and growth due to the incorporation of newly released historical benchmark data from the 2015 AHS. Compared to last quarter’s LIRA release, the updated LIRA now shows lower and less cyclical growth in homeowner improvement and repair spending in 2014 and 2015, a somewhat lower market size estimate, and also more modest projections for remodeling market growth in 2017. According to Joint Center tabulations of the AHS, spending in 2014 and 2015 was not quite as robust as the LIRA model predicted, growing 11.3 percent from $250 billion in 2013 to $278 billion in 2015 compared to LIRA estimated growth of 14.3 percent over this time period. As seen in Figure 1, the lower growth in remodeling spending in 2014 and 2015 has implications for the size of the market projected by the LIRA model for 2016 and 2017.

Notes: Data for 2014 and 2015 are based on estimates from the 2015 American Housing Survey. Data since 2016 are modeled by the LIRA. Source: Joint Center for Housing Studies.

Previously, the LIRA estimated a homeowner improvement and repair market size of $305 billion in 2016 and projected spending growing to $326 billion by the third quarter of this year. Now with the replacement of AHS-based benchmark data for previously modeled benchmark estimates, the LIRA model indicates remodeling activity reached $297 billion in 2016 and projects spending will reach $317 billion this year. The implication of slightly slower growth in actual remodeling and repair spending is a reduction in market size projections for 2017 of 2.9 percent or $9.5 billion. Incidentally, the more modest growth projected by the LIRA for 2017 compared to the prior release is not related to the addition of the new historical benchmark data. The LIRA projections revise routinely as the year-over-year trends in the LIRA inputs are updated or revised.

The weighted average of the LIRA inputs produces the LIRA estimates and projections as seen in Figure 2A (for modeling improvements spending trends) and Figure 2B (for modeling maintenance and repair spending trends) compared to the now updated AHS-based benchmark data series for 1994-2015. The improvements LIRA continued to track the reference series very closely in 2014 and 2015. The estimates produced by the improvements LIRA model and the AHS-based benchmark now have a correlation coefficient of 0.84 (p-value of 0.00). And a simple regression of the LIRA output on the benchmark spending series results in an R-squared value of 0.6759, which suggests that upwards of 70% of the variation, or movement, in the improvements spending benchmark can be explained by the LIRA model.

Sources: JCHS calculations using HUD, American Housing Surveys; Department of Commerce, Retail Sales of Building Materials; and US Census Bureau, Construction Spending Value Put in Place (C-30); Leading Indicator of Remodeling Activity.

Similarly, Figure 2B compares the weighted average output of the maintenance and repair LIRA model to its AHS-based reference series. The maintenance LIRA has also tracked its benchmark fairly well since 2013. The maintenance and repair LIRA and its reference series have a correlation coefficient of 0.73 (p-value of 0.00) and a simple regression of the LIRA output on the benchmark results in an R-squared value of 0.5362, which suggests that about 54% of the movement in the home maintenance and repair spending benchmark can be explained by this LIRA model.

Sources: JCHS calculations using HUD, American Housing Surveys; Department of Commerce, Retail Sales of Building Materials; and US Census Bureau, Survey of Residential Alterations and Repairs (C-50); Leading Indicator of Remodeling Activity.

Last spring, the LIRA was re-benchmarked to a measure of home improvement and repair spending based on estimates from HUD’s biennial American Housing Survey, and at that time, historical remodeling and repair data from the AHS was available for 1994–2013. Until the 2015 AHS data became available, the LIRA model was used to estimate historical improvement and repair spending levels since 2013. Once every two years, with new historical AHS data, the LIRA benchmark series will be updated. With the January 2017 release, the LIRA model will be used to estimate historical spending levels since 2015 until the next biennial release of the American Housing Survey allows for actual 2016 and 2017 spending data to replace modeled estimates.

More information and analysis of recent and expected trends in home improvement and repair activity will be forthcoming in the Joint Center for Housing Studies’ latest biennial Improving America’s Housing report to be released on Tuesday, February 28th.

Friday, December 16, 2016

Rising Interest Rates, and What They Mean for Home Improvement

by Kermit Baker
Director, Remodeling
Futures Program
The recent hike in short-term interest rates by the Federal Reserve Board has raised concerns about what rising interest rates mean for consumer borrowing, particularly how they will affect the demand for home improvement loans. The counterintuitive but probable outcome is that home improvement borrowing is likely to increase, and that borrowers will rely more heavily on loans tied to short-term interest rates, which are expected to rise significantly over the coming year.

Why is this likely to occur?  To begin, it is worth noting that owners undertaking home improvement projects, even larger projects, rely heavily on savings to pay for these projects. Findings from a October 2016 Piper Jaffray Home Improvement Survey are consistent with previous consumer surveys regarding how owners pay for major home improvement projects. Savings continue to be the principal source of funds as 62 percent of respondents planning a project indicated that they would use savings for all or part of the payment. Another 37 percent said they would put all or part of the cost on a credit card, with many of these planning to immediately pay off their balance. In contrast, only 18 percent said they planned to use a home equity line of credit to fully or partially fund their projects.

The relatively low use of home equity loans, which has in fact been trending up in recent years, is due in part to the facts that home equity levels for homeowners fell dramatically after the housing crash and lenders became more restrictive with home equity lending. However, there is another reason why these loans have fallen sharply since the housing crash. Long-term interest rates have been trending down for the past decade, and many owners who want to borrow to finance a home improvement project had another appealing and readily available option: they could refinance their principal mortgage to take advantage of lower rates, and simultaneously pull out some of their equity by increasing the loan amount on their low-interest, fixed-rate, first mortgage.

For much of the past decade, the volume of cash-out refinancing has just about equaled borrowing available through home equity credit lines. However, signs are quite clear now that we are at the end of this near decade-long interest rate down cycle. Interest rates on 30-year fixed rate mortgages, which have been trending up since last summer, spiked almost 50 basis points (one-half percentage point) after the presidential election. Noting that the incoming Trump administration is likely to push for tax cuts and infrastructure spending increases, most forecasters are projecting that long-term interest rates will continue to rise in 2017.

While higher interest rates will discourage some owners from cashing out home equity to undertake home improvement projects, they may actually promote remodeling spending by others. How can this be the case? Rising mortgage rates may encourage many owners to remain in their current homes. Interest rates for 30-year fixed rate mortgages have been below 5 percent since early 2011, so virtually everyone who has purchased a home or refinanced their fixed rate mortgage over the last six years has locked into a historically low mortgage rate. This means that if rates rise, trading up to a more desirable home also involves paying off a low interest mortgage and taking out a new higher rate loan. Facing this prospect, many owners may instead decide to improve their current home rather than buying a home with the features they now desire.

Those owners who want to tap into their growing levels of home equity to finance their home improvement projects are likely to rely on home equity lines of credit rather than cash-out refinancing. As long-term rates have stabilized near their cyclical low, we’ve already seen that homeowners are starting to rely more on home equity credit lines. In the coming months as rates trend up, the gap between home equity borrowing and cash-out refinancing is likely to widen, which, unfortunately, will expose these home equity borrowers to future hikes in short-term rates.

 Click to enlarge

Notes: Calculated as a four-quarter trailing sum.“Cashed out” indicates the dollar volume of equity cashed-out through refinancing of prime, first-lien conventional mortgages. Excludes the refinancing of FHA and VA loans, and refinance loans originated in the subprime market. Home equity credit lines indicates amount of the open line of credit, not the amount that has been utilized.


Source: JCHS tabulations of CoreLogic and Federal Home Loan Mortgage Corporation data, http://www.freddiemac.com/finance/refinance_report.html

Thursday, October 20, 2016

Growth in Remodeling Spending Projected to Peak in 2017

by Abbe Will
Research Analyst
Strong gains in home renovation and repair spending are expected to continue into next year before tapering, according to our latest Leading Indicator of Remodeling Activity (LIRA) released today. The LIRA projects that annual growth in home improvement and repair expenditures will continue to increase, surpassing eight percent by the second quarter of 2017 before moderating somewhat later in the year.

Homeowner remodeling activity continues to be encouraged by rising home values and tightening for-sale inventories in many markets across the country. Yet, a recent slowdown in the expansion of single family homebuilding and existing home sales could pull remodeling growth off its peak by the second half of 2017.

Even as remodeling growth trends back down, levels of spending are expected to reach new highs by the third quarter of next year. At $327 billion annually, the homeowner improvement and repair market will surpass its previous inflation-adjusted peak from 2006.


For more information about the LIRA, including how it is calculated, visit the JCHS website.

NOTE ON LIRA MODEL: As of April 21, 2016, the LIRA has undergone a major re-benchmarking and recalculation in order to better forecast a broader segment of the national residential remodeling market. For more information on this, see our earlier blog post, and read the research note: Re-Benchmarking the Leading Indicator of Remodeling Activity.

Thursday, July 21, 2016

Above-Average Gains in Home Renovation and Repair Spending Expected to Continue

Abbe Will
Research Analyst
Over the coming year, homeowner remodeling activity is projected to accelerate, keeping the rate of growth above its long-term trend, according to our latest Leading Indicator of Remodeling Activity. The LIRA anticipates growth in home improvement and repair expenditures will reach 8.0 percent by the start of 2017, well in excess of its 4.9 percent historical average.

A healthier housing market, with rising house prices and increased sales activity, should translate into bigger gains for remodeling this year and next. As more homeowners are enticed to list their properties, we can expect increased remodeling and repair in preparation for sales, coupled with spending by the new owners who are looking to customize their homes to fit their needs.

By the middle of next year, the national remodeling market should be very close to a full recovery from its worst downturn on record. Annual spending is set to reach $321 billion by then, which after adjusting for inflation is just shy of the previous peak set in 2006 before the housing crash.

 Click to enlarge

For more information about the LIRA, including how it is calculated, visit the JCHS website.

NOTE ON LIRA MODEL: As of April 21, 2016, the LIRA has undergone a major re-benchmarking and recalculation in order to better forecast a broader segment of the national residential remodeling market. For more information on this, see our earlier blog post, and read the research note: Re-Benchmarking the Leading Indicator of Remodeling Activity.

Tuesday, May 10, 2016

Renters Also Have Healthy Housing Concerns

Elizabeth la Jeunesse
Research Analyst
The Joint Center recently released a working paper highlighting American consumers’ concerns and awareness of “healthy housing” issues, which include indoor air quality, water quality and other indoor environmental concerns. One of the more compelling findings of the study was that renters expressed healthy housing concerns at a higher rate than homeowners. Indeed, 36 percent of renters we surveyed reported some level of healthy housing concerns or suspected risks, while only 24 percent of homeowners did. Indoor air quality issues were most prevalent—including dust, dampness and moisture, lack of sufficient ventilation, and other indoor-air related problems including air pollution from outdoors. Other major concerns included water quality, and basic safety issues such as pests, and concerns about the physical structure.

Notes: Sample size is 820.  Renter households were asked, “In the past few years, how concerned have you been about your current rental home negatively affecting your or another occupant’s health?  This may include but is not limited to concerns related to mold/moisture, indoor air quality, asthma, chemicals in the home, noise insulation problems, light issues or other “healthy housing” issues important to you.“
Source: JCHS tabulations of Healthy Home Renter Survey (Summer 2014), The Farnsworth Group

Renters’ high level of concern is not surprising. Results from the American Housing Survey (AHS) showed that as of 2011 renters scored as worse off than owners across nearly every measure of healthy-home risks and concerns. Renters were more likely to live in inadequate housing conditions, encounter mold, musty smells and second-hand smoke from other units, as well as report hazards (loose railings, broken steps, insufficient illumination for stairs) than homeowners.

Along with these indoor issues, health risks in these places can be compounded with higher outdoor air pollution. Results from the 2013 AHS further showed that renters were more likely to report living close to highways/railroads/airports (20 percent) compared to homeowners (9 percent). Another 7 percent of renters reported living near industrial areas, compared to only 3 percent of homeowners. The higher concentrations of outdoor air pollution in these areas can infiltrate the home when ventilation methods do not allow for adequate air filtration.

Another factor that may contribute to renters’ concerns is the condition of their units. The rental housing stock is older, with a median building age of 43 years, vs 38 years for owner-occupied homes. Many older rental structures were not designed to modern standards for indoor environmental health. For example, many older multifamily buildings lack any basic ventilation systems for cooking with gas-stoves. Renters also tend to live in closer proximity to each other, with over 60 percent of renters living in multifamily buildings (vs. 11 percent of homeowners). The associated wear and tear of higher turnover, and neighbors’ behavior such as smoking indoors, can impact renters’ quality of life.

Rental property owners’ maintenance and upkeep behaviors certainly also influence renters’ satisfaction with their living conditions. But while most state and municipal sanitary and housing codes govern most basic issues such as structural integrity and pests, they rarely incorporate newer research on indoor environmental quality concerns. These concerns include formaldehyde in building products, inadequate or non-existent ventilation for gas-stove cooking, second-hand smoke, and other off-gassing chemicals (e.g., VOCs) from indoor furnishings such as carpets and flooring.

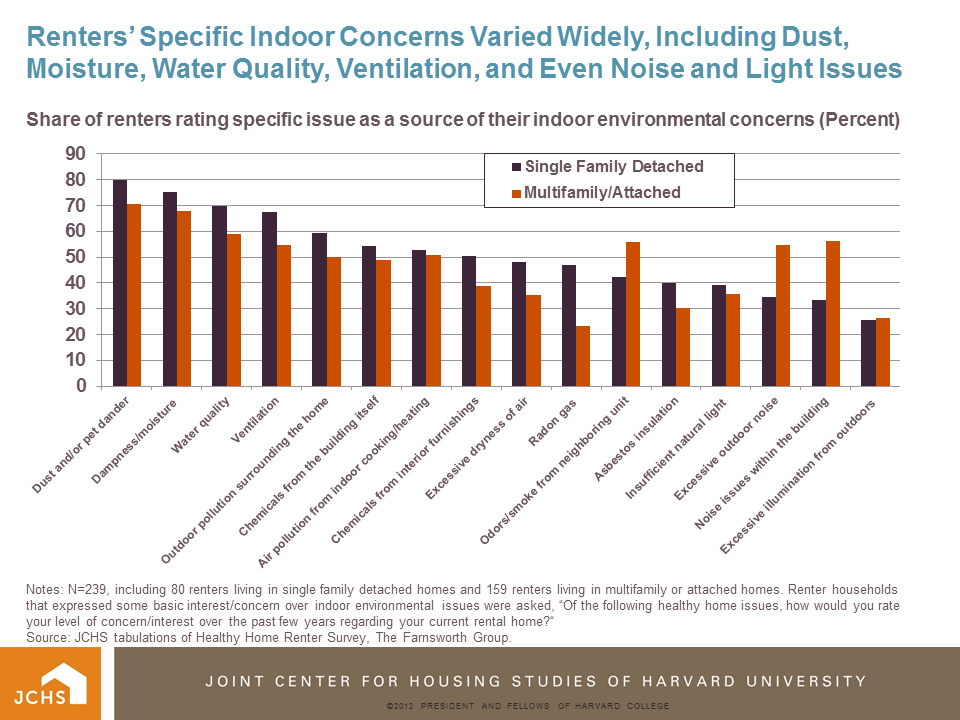
The chart below provides a snapshot of renters’ specific indoor environmental concerns based on our survey results, beyond basic issues typically addressed by housing codes. As it shows, air quality and other indoor issues impacted renters living in both single- and multi-family homes. Dust and moisture concerns were most common. Renters also expressed awareness of chemical issues, including from the building itself but also from interior products/furnishings/carpeting. Among renters living in multifamily structures, noise issues and odors or smoke from neighboring units were also cited frequently.

Notes: N=239, including 80 renters living in single family detached homes and 159 renters living in multifamily or attached homes. Renter households that expressed some basic interest/concern over indoor environmental issues were asked, “Of the following healthy home issues, how would you rate your level of concern/interest over the past few years regarding your current rental home?“
Source: JCHS tabulations of Healthy Home Renter Survey, The Farnsworth Group.

While individual renters can take some minor steps to mitigate indoor environmental risks at home, most renters are limited by the fact that they do not own their units, and therefore have little incentive for—if not an outright prohibition from—making physical modifications to their home. Therefore integrated, long-lasting healthy housing solutions will need to come from multiple stakeholders, including not only property owners, managers and developers, but also building product manufacturers, as well as those who regulate the rental industry. All of these stakeholders should examine ways to incentivize, increase our understanding of, and promote healthier rental housing, including ways to make effective healthy housing strategies for renters more cost-effective.

The growing market for energy efficient housing may set a precedent for how healthy multifamily solutions might take hold. Recently numerous articles have highlighted the good business sense of pursuing energy efficiency. As a recent McGraw Hill study suggested, multifamily builders find that customers are willing to pay more for “green” units. While energy efficiency also saves on energy bills, healthy-home advancements in rental properties can potentially increase resident retention and satisfaction—both of which are of economic benefit to the rental industry.

With the ongoing, rapid development of research related to healthy housing, as well as the tendency of consumers to seek out information on this topic, we expect to see demand in this area to grow in the future. Indeed, as awareness of healthy housing research and risks grows, renters are likely to increase their demand for healthy housing attributes. Rental property owners who can get out in front of this trend may be better poised down the line to capitalize on the growing demand for health-conscious home environments.

Thursday, April 21, 2016

Robust Remodeling Growth Anticipated by Re-Benchmarked LIRA

Abbe Will
Research Analyst

Strongly accelerating growth in home improvement and repair spending is expected heading into 2017, according to the newly re-benchmarked Leading Indicator of Remodeling Activity (LIRA) released today. The new and improved LIRA projects that home remodeling spending will increase 8.6% by the end of 2016 and then further accelerate to 9.7% by the first quarter of next year.

Ongoing gains in home prices and sales are encouraging more homeowners to pursue larger-scale improvement projects this year compared to last with permitted projects climbing at a good pace. On the strength of these gains, the level of annual spending for remodeling and repairs is expected to reach nearly $325 billion nationally by early next year.

Notes: The former LIRA modeled homeowner improvement activity only, while the re-benchmarked LIRA models home improvement and repair activity. Historical estimates are produced using the LIRA model until American Housing Survey data become available.

Source: Joint Center for Housing Studies.

Our freshly recalibrated indicator now forecasts a broader segment of the national residential remodeling market that includes both improvement and repair activity to the owner-occupied housing stock. With this re-benchmarking, the LIRA now more accurately sizes the remodeling market and continues to anticipate major turning points in the spending cycle.

For more information about the LIRA, including how it is calculated, visit the Joint Center website.

Note on the LIRA model: As of April 21, 2016, the LIRA has undergone a major re-benchmarking and recalculation in order to better forecast a broader segment of the national residential remodeling market. For more information on the implications of this change, see our earlier blog post, and read the research note:
N16-4: Re-Benchmarking the Leading Indicator of Remodeling Activity.

Wednesday, February 10, 2016

Five-Year Failure Rates for Remodeling Contractors Exceeded 50% During Downturn

Abbe Will
Research Analyst
Newly available data from the U.S Census Bureau confirms that the severe drop in home improvement spending that accompanied the housing market crash and Great Recession put a great many remodeling contractors out of business. Although remodeling businesses of all sizes experienced very large failure rates, smaller-scale businesses, which are most typical of the industry, were considerably more likely to fail during the downturn.

Utilizing the longitudinal nature of the Census Bureau’s Business Information Tracking Series (BITS), it is possible to calculate failure and survivorship rates of construction businesses with payrolls during the last economic downturn from 2007-2012. According to custom tabulations commissioned by the Remodeling Futures Program, fully half (51.0%) of general residential remodeling businesses in 2007 were no longer operating by 2012. New housing construction businesses suffered similar exoduses: 52.6% for single-family builders and 52.2% for multifamily builders. Specialty contractors, however, such as roofing, electrical, and plumbing and HVAC specialists experienced much lower five-year failure rates ranging from 33.1% for plumbing/HVAC specialists to 39.1% for roofing companies. These lower failure rates are not surprising since the specialty trades also include contractors that serve the non-residential construction sector, which did not suffer the same steep declines as the residential market.

Business size is a significant indicator of failure or survival. An astounding seven in ten residential remodeler establishments with $100,000 or less in business receipts in 2007 were no longer in operation by 2012 (Figure 1). The failure rate, while still high, drops sharply to one in four for the largest remodelers in 2007 with $5 million or more in receipts. Businesses surviving the industry downturn were in fact larger: 61.1% had receipts of $250,000 or more in 2007, while almost the exact same share of remodelers that did not survive (62.1%) had revenues of less than $250,000.
Source: US Census Bureau, 1989-2012 Business Information Tracking Series.


Interestingly, of the general remodelers that were able to remain in business during the steep industry slump, over 45% did so even as their business receipts dropped by 25% or more (Figure 2). Another 16% experienced lesser declines in revenue from 2007-2012, but declines nonetheless. Surely, the relatively larger scale of surviving remodeling companies provided important cushions for riding out the cycle. The rest of remodelers that remained in business over this period, about 40%, were able to successfully scale back, restructure, or otherwise take advantage of reduced competition to actually increase their revenues during the worst industry downturn on record. The vast majority of these remodeling contracting businesses saw receipts increase by 5% or more from 2007-2012.
Source: US Census Bureau, 1989-2012 Business Information Tracking Series.

These multi-year failure and survivorship rates mask the full dynamics of business openings and closings, however. In 2003, heading into the housing and home improvement boom years, about 18% of residential remodeling establishments were new businesses. In 2007, at the peak of the market, this share stood at 16%. During the trough years of this past business cycle, the share of remodeling businesses that were start-ups barely budged at 15-16% in 2008, 2009, and 2011. One-year failure rates during the same periods have ranged from a low of 12.9% in 2004 to 19.8% in 2009 and 14.4% at last measure in 2012. Indeed, in any given year and at all points in the business cycle, the remodeling industry experiences substantial churn of business entrances and exits.

It is important to note that the BITS database is of payroll businesses only and as such does not track movement from payroll to non-payroll, or self-employed, businesses, which is likely a common occurrence for many smaller contracting companies serving the remodeling industry. According to Joint Center tabulations of the 2007 Economic Census of the construction industry, nearly a quarter of general residential remodelers had less than $100,000 in receipts and the average business of this size had 0.93 payroll employees, indicating that some of these firms were without employees for at least a portion of the survey year. Another 27% of general remodelers had revenues of $100,000-$249,000 in 2007 and only 1.64 employees on average.

Certainly, some part of the calculated “failure” rates cited above is due to payroll businesses moving to self-employed status rather than actually going out of business. Indeed, the term “failure” is used only as shorthand to mean the establishment ceases to exist in the BITS database and not necessarily that the business failed to generate enough revenue to cover expenses. In addition to conversion to self-employment, other non-failure reasons for a business to cease to exist in the BITS file could include retirement of the proprietor or sale of the business to another entity.