Tuesday, December 20, 2016

Panel Discussions Focus on Housing Policy in the Next Administration

by Shannon Rieger
Research Assistant
From tax reform to fair housing, the incoming Trump administration and new Congress are likely to adopt policies that could greatly affect housing, particularly affordable subsidized housing, noted speakers at a conference held in Boston last week. Organized by The New England Housing Network, a broad coalition of housing and community development organizations from the six New England states, the December 16th event focused on what the new administration and Congress will “do about the unmet need for affordable housing in our country” and what advocates can do to encourage a robust federal affordable housing agenda in 2017.

Speakers, including national experts, state officials, and leading advocates from throughout New England, touched on a variety of issues, including tax reform, the future of Government Sponsored Enterprises (GSEs), infrastructure initiatives, anti-poverty programs, and fair housing policies. Everyone noted that many current programs and initiatives are threatened and that much of the discussion is speculative because there is tremendous uncertainty surrounding the Trump administration’s plans, as well as the likelihood that Congress may not support the new administration’s policies. Nevertheless, panelists discussed several potential strategies for bringing together an effective coalition to advocate for affordable housing at a particularly challenging time.

(Photo courtesy of Asian Community Development Corporation)

In opening remarks, several panelists warned that the incoming Trump administration’s stated focus on increasing defense spending while cutting corporate taxes from 35 to 15 percent will shrink the non-defense discretionary budget. With new capital investment therefore unlikely to materialize, several panelists noted that it will be tempting – and perhaps necessary – to go into “preserve and protect” mode to maintain existing affordable housing programs.  However, discussants went on to emphasize the importance of pushing back against proposed spending cuts instead of focusing on potential losses. The panelists agreed that agencies and advocates must join forces to fight for the common goal of increasing overall non-defense spending, and pointed out that squabbling over the pieces of a shrinking pie would likely only undermine critical potential alliances.

Identifying and fostering cross-sector alliances and interdependencies emerged as a central theme throughout the forum. The panelists suggested that lifting up housing’s strong ties to health and to economic opportunity, in particular, will be critical in order to keep housing on the agenda. Barbara Fields, Executive Director of Rhode Island Housing, a state entity that works with developers and non-profit groups, illustrated how this might be accomplished by referencing an oft-cited quote from Rakesh Mohan, Deputy Governor of the Federal Reserve Bank of India, who in 2007 said, “Because housing is where jobs go to sleep at night, the quantity, quality, availability and affordability of housing is a key component in national economic competitiveness.”

Similarly, Chris Estes, President and CEO of the National Housing Conference, recalled Megan Sandel’s description of housing as a “vaccine” that can improve health.  Chrystal Kornegay, Undersecretary of the Massachusetts Department of Housing and Community Development, added that we should think of housing as a beginning rather than an end, highlighting housing’s potential to bring together a variety of groups that ordinarily might not collaborate.

Turning to specifics, panelists noted that tax reform could dramatically affect both the Low-Income Housing Tax Credit (LIHTC) and Private Activity Bonds. Panelists referenced a House bill that would eliminate Private Activity Bonds but keep LIHTC, while a Senate bill introduced in May 2016 would expand the LIHTC program by 50 percent. They also discussed House Speaker Paul Ryan’s June 2016 tax plan which, by greatly increasing the standard deduction, would substantially reduce use of the mortgage interest deduction. Although it is far from certain that this proposal will become law, panelists suggested that if reforms do happen, housing advocates should insist that any revenue generated by the changes be re-invested in housing on measures such as a renters’ tax credit and not used for other purposes.

Discussants also noted that Treasury Secretary designate Steven Mnuchin and key members of Congress appear to significantly disagree on GSE reform. Mnuchin has said he is interested in seeing that Fannie Mae and Freddie Mac are taken out of “government ownership,” restructured, and privatized.  However, Congress has not demonstrated support for a “recap and release” of the GSEs. These disagreements may impede any efforts to reform GSEs, noted several panelists.

The conflicting perspectives about both issues within the Republican Party will make it hard to substantially change the tax code or restructure the GSEs, said Benson “Buzz” Roberts, President and CEO of the National Association of Affordable Housing Lenders. He also noted that “inertia is the most powerful third party in the United States”, and may slow down or even block substantial changes in tax policy or GSE reform in the next several years.

Several panelists pointed out that President-Elect Donald Trump’s plan to substantially increase spending on infrastructure explicitly includes roads, bridges, tunnels, airports, railroads, ports and waterways, and pipelines. However, they added, it is unclear whether or not housing will (or could) be part of this spending package.  Including housing in those programs, panelists noted, might be an effective way to fund housing in coming years. In thinking about how to effectively communicate the role of housing as an economic engine, Fields suggested that investments in the skilled labor needed to build housing (along with the other forms of infrastructure explicitly mentioned in the Trump administration’s plan) may help to mitigate existing labor shortages and grow the economy.

Turning to anti-poverty, mobility, and fair housing policies under the incoming Trump administration, the discussants agreed that the AFFH (Affordably Furthering Fair Housing) initiative will certainly be under threat from a Republican-majority Congress and from incoming HUD Secretary Ben Carson, who last year wrote an op-ed denouncing the rule. The future of anti-poverty policies is less certain. Speaker Ryan’s “welfare reform 2.0” plans are the most concrete indication of how the Trump Administration might approach “anti-poverty” policy. Ultimately, panelists concluded that while there is little concrete information about how the Trump administration will proceed in this arena, the strong focus of the Trump campaign on economic opportunity and mobility for all Americans may present some opportunities. For example, by highlighting housing’s role in advancing mobility, housing advocates could align a housing agenda with other Trump administration priorities.

Taken together, the upshot of the discussions was that while many existing programs and initiatives could be under threat, the future of housing policy in a Trump administration is very uncertain.  Opportunities may arise from uncertainty, though, such as the potential to insist that housing be included as a part of infrastructure investment. The panelists added that recognizing such opportunities, and starting today to proactively build strong, cross-sector coalitions able to take advantage of potential openings, will be critical to advancing an affordable housing agenda in coming years. 

Friday, December 16, 2016

Rising Interest Rates, and What They Mean for Home Improvement

by Kermit Baker
Director, Remodeling
Futures Program
The recent hike in short-term interest rates by the Federal Reserve Board has raised concerns about what rising interest rates mean for consumer borrowing, particularly how they will affect the demand for home improvement loans. The counterintuitive but probable outcome is that home improvement borrowing is likely to increase, and that borrowers will rely more heavily on loans tied to short-term interest rates, which are expected to rise significantly over the coming year.

Why is this likely to occur?  To begin, it is worth noting that owners undertaking home improvement projects, even larger projects, rely heavily on savings to pay for these projects. Findings from a October 2016 Piper Jaffray Home Improvement Survey are consistent with previous consumer surveys regarding how owners pay for major home improvement projects. Savings continue to be the principal source of funds as 62 percent of respondents planning a project indicated that they would use savings for all or part of the payment. Another 37 percent said they would put all or part of the cost on a credit card, with many of these planning to immediately pay off their balance. In contrast, only 18 percent said they planned to use a home equity line of credit to fully or partially fund their projects.

The relatively low use of home equity loans, which has in fact been trending up in recent years, is due in part to the facts that home equity levels for homeowners fell dramatically after the housing crash and lenders became more restrictive with home equity lending. However, there is another reason why these loans have fallen sharply since the housing crash. Long-term interest rates have been trending down for the past decade, and many owners who want to borrow to finance a home improvement project had another appealing and readily available option: they could refinance their principal mortgage to take advantage of lower rates, and simultaneously pull out some of their equity by increasing the loan amount on their low-interest, fixed-rate, first mortgage.

For much of the past decade, the volume of cash-out refinancing has just about equaled borrowing available through home equity credit lines. However, signs are quite clear now that we are at the end of this near decade-long interest rate down cycle. Interest rates on 30-year fixed rate mortgages, which have been trending up since last summer, spiked almost 50 basis points (one-half percentage point) after the presidential election. Noting that the incoming Trump administration is likely to push for tax cuts and infrastructure spending increases, most forecasters are projecting that long-term interest rates will continue to rise in 2017.

While higher interest rates will discourage some owners from cashing out home equity to undertake home improvement projects, they may actually promote remodeling spending by others. How can this be the case? Rising mortgage rates may encourage many owners to remain in their current homes. Interest rates for 30-year fixed rate mortgages have been below 5 percent since early 2011, so virtually everyone who has purchased a home or refinanced their fixed rate mortgage over the last six years has locked into a historically low mortgage rate. This means that if rates rise, trading up to a more desirable home also involves paying off a low interest mortgage and taking out a new higher rate loan. Facing this prospect, many owners may instead decide to improve their current home rather than buying a home with the features they now desire.

Those owners who want to tap into their growing levels of home equity to finance their home improvement projects are likely to rely on home equity lines of credit rather than cash-out refinancing. As long-term rates have stabilized near their cyclical low, we’ve already seen that homeowners are starting to rely more on home equity credit lines. In the coming months as rates trend up, the gap between home equity borrowing and cash-out refinancing is likely to widen, which, unfortunately, will expose these home equity borrowers to future hikes in short-term rates.

 Click to enlarge

Notes: Calculated as a four-quarter trailing sum.“Cashed out” indicates the dollar volume of equity cashed-out through refinancing of prime, first-lien conventional mortgages. Excludes the refinancing of FHA and VA loans, and refinance loans originated in the subprime market. Home equity credit lines indicates amount of the open line of credit, not the amount that has been utilized.


Source: JCHS tabulations of CoreLogic and Federal Home Loan Mortgage Corporation data, http://www.freddiemac.com/finance/refinance_report.html

Tuesday, December 13, 2016

New Report: Number of Older Adults in the US Expected to Surge, Highlighting Need for Accessible Housing and Policy Improvements

Download the Report
By 2035, more than one in five people in the US will be aged 65 and older and one in three households will be headed by someone in that age group, according to our new report, Projections and Implications for Housing a Growing Population: Older Adults 2015-2035, released today. This growth will increase the demand for affordable, accessible housing that is well connected to services beyond what current supply can meet.

As the baby boom generation ages, the US population aged 65 and over is expected to grow from 48 million to 79 million, and the number of households headed by someone over 65 will increase by 66 percent, to nearly 50 million. This growth will increase the demand for housing units with universal design elements such as zero-step entrances, single-floor living, and wide halls and doorways.  However, only 3.5 percent of homes offer all three of these features.

“The housing implications of this surge in the older adult population are many,” says Chris Herbert, managing director of the Joint Center. “and call for innovative approaches to respond to growing need for housing that is affordable, accessible and linked to supportive services that will grow exponentially over the next two decades.”

In the coming years, many older adults will have the financial means to pay for appropriate housing and supportive services that allow them to live longer in their own homes. However, many others will face financial hardships, particularly because their incomes will decline in retirement. Low-income renters are particularly vulnerable, notes the report, which projects that nearly 6.4 million low-income renters will be paying more than 30 percent of their income for housing by 2035. The report adds that 11 million homeowners will be also be in this position by that time. In total, the report estimates, 8.6 million people will be paying more than half their income for housing by 2035. The report also projects that 7.6 million older adults will have incomes that would qualify them for federal rental subsidies by 2035, an increase of 90 percent from 2013. “Today, however, we only serve one-third of those who qualify for assistance,” says Jennifer Molinsky, a senior research associate at the Joint Center and lead author of the report. “Just continuing at this rate—which would be a stretch—would leave 4.9 million people to find affordable housing in the private market.”

The report notes that in many surveys, older adults express a strong desire to live at home for as long as possible. Achieving that goal will require public and private action to support modifications to existing homes, take steps to address the affordability challenges facing both owners and renters, and adapting the health care system to enhance service delivery in the home. There is also a need to expand the range of housing options available to better meet the needs of an aging population and improve options for older adults to remain in their community when their current home is no longer suitable. 

“The implications of our aging US population on the housing industry are unambiguous,” says Lisa Marsh Ryerson, President of AARP Foundation, which provided funding for the report. “It will be imperative, in the coming years, that the housing industry, policymakers, and individuals take action to address the need for housing that will enable millions of older adults in this country to live with security, dignity, and independence.”


Join the conversation on Twitter: #harvardhousingreport

Monday, December 12, 2016

Three Scenarios for the Future of Homeownership Rates

by Jonathan Spader
Senior Research Associate
Following the rise and fall in the homeownership rate over the past two decades, considerable uncertainty exists about the homeownership rate’s future trajectory. In a new working paper, I present three plausible scenarios and examine the implications of different homeownership rate outcomes for future growth in the number of homeowner and renter households. (A supplemental working paper provides additional analysis of the factors that have contributed to the homeownership rate’s decade-long decline.)

The tenure projections for growth in the number of homeowner and renter households through 2035 build directly on household growth projections also released by the Joint Center this week. We use these household growth estimates, along with data on homeownership rates from the Census Bureau’s Annual Social and Economic Supplement to the Current Population Survey (CPS/ASEC), to construct three scenarios that reflect a range of possible homeownership outcomes.
  • Scenario 1 (“Base Scenario”) – Constant homeownership rates. The base scenario applies the 2015 homeownership rates by age, race/ethnicity, and family type to the projected household counts for each year. This scenario therefore describes the likely outcomes if homeownership rates stabilize near their current levels. By holding homeownership rates constant, this scenario also reveals the implications of changes in the distribution of U.S. households by age, race/ethnicity, and family type for the future homeownership rate.
  • Scenario 2 (“Low Scenario”) – Continued decline through 2020 followed by constant homeownership rates. The starting point for the low scenario is the set of 2015 homeownership rates for each age, race/ethnicity, and family type category. The low scenario then projects the 2020 rates for each category by applying the 5-year cohort trends observed from 2010-2015. The 2020 homeownership rates for each age, race/ethnicity, and family type category are then held constant to project the homeownership rates for 2025, 2030, and 2035. This scenario describes the likely homeownership outcomes if the homeownership rate’s ongoing decline continues for several more years before stabilizing.
  • Scenario 3 (“High Scenario”) – Homeownership rates return to pre-boom levels. The third scenario applies constant homeownership rates determined by the maximum of the 1995 and the 2015 rate for each age, race/ethnicity, and family type category. This scenario uses the 1995 homeownership rates to define the pre-boom levels that might reflect a longer-term equilibrium. It then adjusts the rates upward to the 2015 rates for older households and other groups for whom longer-term upward trends have kept the 2015 rates above their 1995 levels. The resulting homeownership rates therefore define a high scenario in which homeownership rates increase to levels slightly above than their 1995 levels, but well below their mid-2000s peaks. While such homeownership rate increases may be more plausible over longer-term periods than in the next few years, the high scenario applies these rates to all time periods, providing estimates of homeowner growth if the rates are realized within each time horizon.
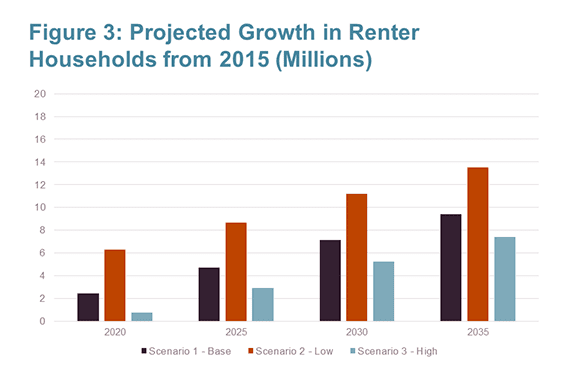
The base scenario shows that changes in the distribution of households by age, race/ethnicity, and family type will not substantially alter the homeownership rate between 2015 and 2035. Rather, the homeownership rate would increase slightly from 63.5 percent in 2015 to 63.7 percent in 2025 before falling to 63.3 percent in 2035. (Figure 1) Because the base scenario holds the rates for each age, race/ethnicity, and family type category constant at their 2015 levels, the changes (or lack thereof) reflect the cumulative effect of trends in the profile of U.S. households, such as population aging, increased racial and ethnic diversity, and delayed marriage and childbirth. The upshot is that these trends largely offset one another, affecting the overall homeownership rate only minimally. Instead, increases in the number of homeowner and renter households are driven by household growth, producing 8.9 million additional homeowner households and 4.7 million additional renter households by 2025, and 15.7 million additional homeowner households and 9.4 million additional renter households by 2035. (Figures 2 and 3)

Source: JCHS tabulations of CPS ASEC data

 Click to enlarge
Source: JCHS tabulations of CPS ASEC data

 Click to enlarge
Source: JCHS tabulations of CPS ASEC data

While the base scenario’s projections halt the decade-long decline in the homeownership rate, the projected homeownership rates remain below their levels between 1985 and 2015. This partial recovery reflects the possibility that slowing foreclosures and a strengthening economy will ease the downward pressure on the homeownership rate in coming years, while also allowing for the foreclosure crisis and Great Recession to carry some lasting impacts. The relative importance of these offsetting pressures will only be known with time, so the base scenario’s projections should be interpreted as a reference point for homeownership outcomes if the overall rate stabilizes around its 2015 level.

The low scenario describes the consequences of continued declines through 2020 before the homeownership rate stabilizes. Under this scenario, the projected homeownership rate falls from 63.5 percent in 2015 to 60.7 percent in 2020 before leveling off at 60.8 percent in 2025 and 60.6 percent in 2035. The homeowner growth figures show that the continuation of the 2010-2015 cohort trend implies minimal growth in the number of homeowner households, adding just 755,471 additional homeowner households through 2020. In subsequent years, the eventual stabilization of the homeownership rate at 2020 levels allows household growth to add 4.9 million homeowner households through 2025 and 11.6 million homeowner households through 2035. This sluggish growth in homeowner households is accompanied by faster increases in the number of renter households, with 8.7 million additional renter households by 2025 and 13.5 million additional renter households by 2035.

The projected declines in the homeownership rate through 2020 reflects the replication of recent cohort trends from the starting point of cohorts’ already-low 2015 homeownership rates. The projected 2020 rates therefore assume a continuation of the foreclosure-related homeownership exits, tight credit conditions, weak incomes, and other factors that contributed to the homeownership rate’s recent declines. Additionally, they assume the absence of any catch-up growth due to pent up demand among households unable to buy a home in recent years or to homeownership reentries among households that experienced a foreclosure. The low scenario therefore defines a trajectory that reflects the continuation of recent declines for several more years before the homeownership rate stabilizes.

In contrast, the high scenario projections describe homeownership outcomes under assumptions that project a reversal of recent declines and returns homeownership rates to levels slightly above the pre-boom period. The projected homeownership rates for the high scenario increase from 63.5 percent in 2015 to 64.9 percent in 2020, before leveling off at 65.0 percent in 2025 and 64.7 percent in 2035. This higher homeownership rate trajectory implies the addition of 10.6 million homeowner households and 2.9 million renter households by 2025, and 17.7 million homeowner households and 7.4 million renter households by 2035.

The higher homeownership rates produced by this scenario reflect the combination of 1995 homeownership rates with an adjustment for longer-term upward trends in the homeownership attainment of certain groups, particularly older households. While there is no clear “normal” equilibrium for the homeownership rate, this scenario adopts the 1995 rates as the most recent year that precedes the housing boom and bust. Additionally, it assumes that any groups with higher levels of homeownership attainment in 2015 compared to 1995 will sustain the higher 2015 levels into the future. This assumption implies an uptick in cohort trends that fully catches up to the level defined by the maximum of the 1995 or 2015 rate. This result may be particularly tenuous for middle-aged households, who experienced the most severe effects of foreclosures and may not reach the homeownership rates of prior cohorts. To the extent that the foreclosure crisis and Great Recession have had significant impacts for some cohorts, this scenario therefore assumes that such effects will be offset by broader changes in the economy, credit conditions, or housing markets over time.

Read the working papers:

Waiting for Homeownership: Assessing the Future of Homeownership, 2015-2035

Homeowner Households and the U.S. Homeownership Rate: Tenure Projections for 2015-2035

Updated Household Projections, 2015-2035: Methodology and Results


Thursday, December 1, 2016

Have Recent Demographic Trends Contributed to the Rise and Fall of the Homeownership Rate?

by Jonathan Spader
Senior Research Associate
What has caused the ongoing, decade-long decline in homeownership in the United States? And which factors are most likely to influence homeownership rates in the future?

Discussions of the declining homeownership rate—which fell from 69 percent at its mid-2000s peak to below 64 percent in 2015—frequently point to demographic trends, such as delayed marriage and childbirth, an increasingly diverse U.S. population, and changing attitudes and preferences among both Millennials and retiring baby boomers, as the primary source of the decline. However, non-demographic factors like high foreclosure rates, tightening credit standards, and falling household incomes probably also contributed to the recent declines. To better understand the relative importance of the demographic changes, I used data from the Current Population Survey’s Annual Social and Economic Supplement (CPS/ASEC) for 1985-2015 to examine the extent to which changes in the distribution of U.S. households by age, race/ethnicity, and family type contributed to both the rise and fall in the homeownership rate over the past two decades.

I found that while there have been significant demographic changes in the last 30 years, these changes alone do not explain the last decade’s drop in homeownership rates. Nor do demographic trends explain why the homeownership rate rose from about 64 percent in 1990 to 69 percent in 2005. Rather, changes in the demographic profile of U.S. households suggest that the homeownership rate should have steadily declined by about 1-2 percentage points between 1985 and 2015. This, in turn, suggests that the rise and fall in the homeownership rate between 1985 and 2015 reflects changes in the broader economy, home price appreciation, mortgage credit conditions, and possibly household preferences for owning versus renting that alter the likelihood that demographically-similar households are homeowners.

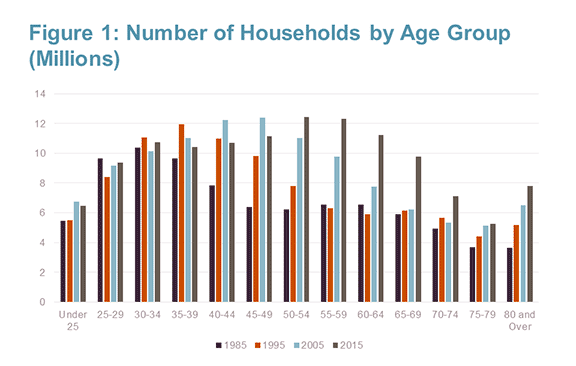
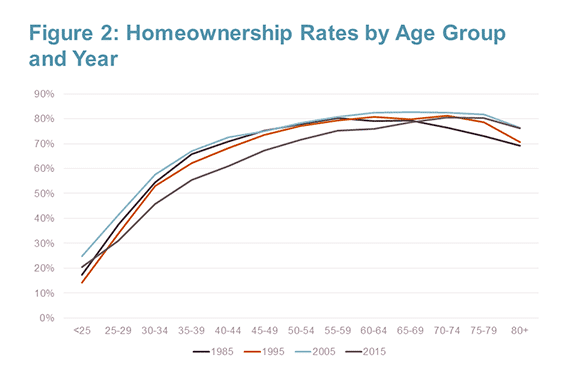
Several demographic trends are reshaping the profile of U.S. households. First, the aging of the baby boomer generation has increased the number of households in older age cohorts. For example, the number of households headed by an individual age 55-59 hovered near 6.5 million from 1985 to 1995 before increasing to 9.8 million in 2005 and 12.3 million in 2015. (Figure 1) This shift has put upward pressure on the homeownership rate by increasing the number of households in older age cohorts, which have higher homeownership rates than younger age cohorts. (Figure 2) In coming years, the baby boom generation will continue to reshape the profile of U.S. households as they reach the oldest age groups.

 Click to enlarge

 Click to enlarge

Second, the racial and ethnic makeup of U.S. households is changing. The share of white non-Hispanic households declined from 81.3 percent in 1985 to 67.6 percent in 2015. Over the same period, the share of black households increased from 10.8 percent to 12.5 percent, the share of Hispanic households more than doubled from 5.6 percent in 1985 to 13.0 percent in 2015, and the share of Asian and all other households more than tripled from 2.2 percent in 1985 to 6.8 percent in 2015. (Figure 3) The implications of these trends for the homeownership rate depend on whether historical differences in homeownership rates across groups will persist in coming years. Historical CPS data suggest that the Hispanic-White and Asian/Other-White gaps in homeownership rates narrowed only slightly between 1985 and 2015, whereas the Black-White gap increased from 24.6 percentage points in 1985 to 28.8 percentage points in 2015. (Figure 4)

 Click to enlarge

 Click to enlarge

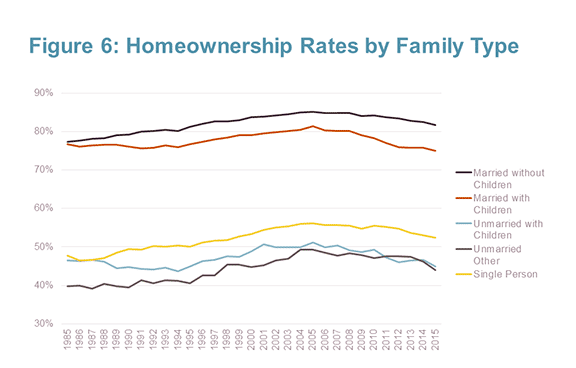
Third, larger numbers of young households are delaying marriage and childbirth until later in life, or forgoing them entirely. The share of households headed by a married couple decreased steadily from 58.9 percent in 1985 to 49.9 percent in 2015. The reduction is due entirely to decreases in the share of married couples with children, as the share of married couples without children remained approximately constant during this period. The decline is offset by increases in the share of single person households, unmarried households with children, and other unmarried households. (Figure 5) While homeownership rates for all groups have declined in recent years, the rates are consistently highest for married couples with children. (Figure 6)

 Click to enlarge

 Click to enlarge

To estimate the cumulative effect of these trends, I conducted shift-share analyses using the CPS/ASEC data. These analyses hold constant homeownership rates at their levels in various years to reveal the extent to which changes in the homeownership rate are driven by changes in the number of households in each age, race/ethnicity, and family type group. For example, using the 1985 sample, I calculated the 1985 homeownership rates associated with each combination of the 13 age groups, 4 racial/ethnic groups, and 5 family type groups shown in the figures above—creating 260 categories in total. For each of the years from 1986-2015, we can then calculate what the U.S. homeownership rate would have been if the homeownership rates for each group remained at the 1985 level. (Readers seeking a more detailed description of the methodology for this analysis can consult a forthcoming JCHS working paper.)

Figure 7 displays the results of such calculations when rates are held constant at their levels in 1985, 1990, 1995, 2000, 2005, 2010, and 2015. The projected homeownership rates suggest that changes in the profile of U.S. households by age, race/ethnicity, and family type do not explain the boom and bust trends in homeownership rates since the early 1990s. Rather, these factors predicted a modest decline in the homeownership rate of about 1-2 percentage points between 1995 and 2015. However, the overall predicted homeownership level varies sharply across the various years, which is the result of unmeasured changes across time in the broader economy, home price appreciation, mortgage credit conditions, and possibly household preferences for owning versus renting that alter the likelihood that demographically-similar households were homeowners in different years.

 Click to enlarge

For a second analysis, I added additional variables to the shift-share analysis using a regression model to calculate the homeownership rates associated with each variable. (Again, more detail about the methodology can be found in the forthcoming working paper.) Specifically, the second analysis adds information on household income, employment status of the head and spouse, educational achievement, veteran status, and more detailed measures of marital status and the presence of children in the household. The projected homeownership rates from this analysis show that while these factors produce more volatile projections, they explain very little of the rise and fall in the actual homeownership rate between 1985 and 2015. The one possible exception is the period from 1996 to 2000, when rising incomes and employment help to explain a portion of the rise in the homeownership rate at that time. However, these factors are not able to explain the continued rise of the homeownership rate following the 2001 recession or the subsequent bust in the latter part of the decade. (Figure 8)

 Click to enlarge

Taken together, these findings suggest that demographic factors explain very little of the rise and fall in the homeownership rate from 1985-2015. Rather, changes in the profile of U.S. households during this period have placed competing pressures on the homeownership rate and largely offset one another. Looking forward, the aging of the baby boom generation and the coming of age of the Millennial generation are similarly unlikely to substantially alter the homeownership rate in the near future. Instead, the trajectory of the homeownership rate depends more heavily on how quickly the foreclosure backlog clears, how many people who lost their homes to foreclosure buy homes in the future, how long mortgage credit conditions remain tight, and whether young households’ slowed rates of homeownership entry persist in future years. Additionally, any major changes in the broader economy, housing finance system, or attitudes toward homeownership may also influence future homeownership rates to the extent that they alter households’ demand or access to homeownership.