 |
| by George Masnick Senior Research Fellow |
These findings emerge from additional analyses of data used in a first-ever report on the characteristics of three generations of US residents by nativity that was released late last month by the Census Bureau. The report is the first to use a unique question in the Current Population Survey‘s Annual Social and Economic Supplement (CPS/ASEC) asking the birthplace of both the respondent and the respondent’s parents. This allows one to identify people born abroad (1st generation), native-born children of at least one immigrant parent (2nd generation), and those whose parents were both born in the United States (3rd-and-higher generations).
The Census report discusses differences among the three groups in such areas as age, education, labor force participation, income, poverty, occupation, and homeownership. The last section is particularly interesting because other Census Bureau data the Joint Center has used to study homeownership, such as the Decennial Census, the American Community Survey, and the American Housing Survey, do not ask respondents where their parents were born. Moreover, as I have shown in an earlier post that also used CPS/ASEC data, immigrants are an important part of a recovering housing market. Foreign-born people have accounted for about one-third of all net household formations over the past two decades, and slightly under 30 percent of all gains in owner-occupied housing. Fully half of all household growth between 1994 and 2014 by under-30-year-olds came from 2nd generation children of immigrants, and another 35 percent from immigrants themselves.
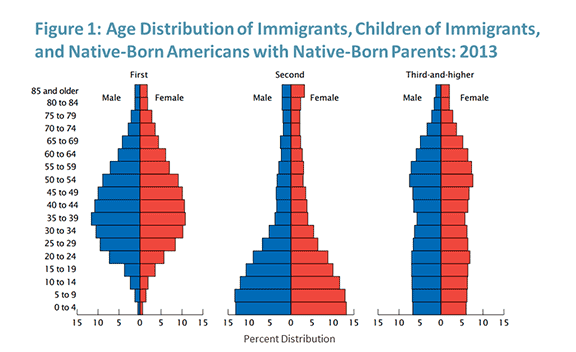
The Census Bureau report notes that incomes and homeownership rise sharply between the 1st and 2nd generations but tend to level off for the 3rd-and-higher-generations. However, these findings may obscure significant differences between the 2nd and 3rd-plus generations because, as other parts of the Census Bureau report note, the generations have dramatically different age distributions. In particular, the majority of immigrants are middle-aged, and their children are 20 or younger. Adult children of immigrants have their largest percentages in the under-30 age group. Baby boomers dominate the 3rd-and-higher generations at age 50-70 in 2013 (Figure 1).
Source: U.S. Census Bureau, Characteristics of the U.S. Population by Generational Status: 2013, Current Population Survey Reports, Nov. 2016, Figure 9.
Source: Joint Center for Housing Studies tabulation of 2015 CPS/ASEC data.
The need to control for age is especially important when examining generational differences in homeownership. In four of the five household family types discussed in the Census report, when age is not controlled, 2nd generation homeownership rates are lower than those for the 3rd-and-higher generations (and in the fifth, the difference between the groups is quite small) (Figure 3).
Source: U.S. Census Bureau, Characteristics of the U.S. Population by Generational Status: 2013, Current Population Survey Reports, Nov. 2016, Fig. 28.
If we control for age, would 2nd generation homeownership rates still be lower than those for the 3rd-and-higher generations? Also, since the Census report examined generational differences for a single year (2013), if there are differences by age, how well have they held up over time?
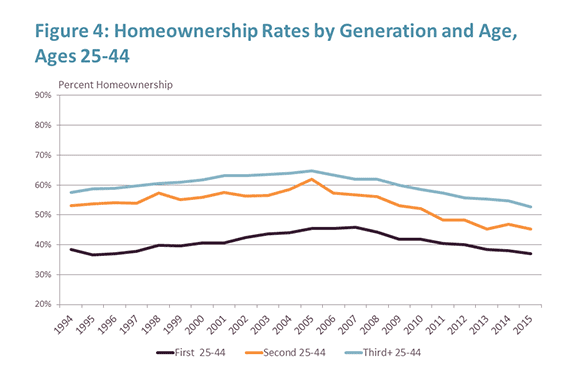
To answer these questions, we examined homeownership rates by age by 5-year age groups for the three generations for each year 1994-2015. These tabulations first can be summarized by examining the trends for two broad age groups (Figures 4 and 5). For households age 25-44, 2nd generation homeownership rates are well above those of their parents’ generation but below those of the later generations. This last pattern is partly explained by the greater concentration of younger 25-34 year olds in the broader 25-44 age group for the 2nd generation, and probably also due to the greater concentration of immigrants and their children in locations that have below average homeownership rates, such as the Los Angeles, San Francisco, New York City, Boston, and Chicago metropolitan areas. There might also be a greater ability of 3rd-and-higher generation parents to help their children financially in buying their first home, and a corresponding need for children of immigrants to save longer for a downpayment.
Source: Joint Center for Housing Studies tabulations of 1994 through 2015 CPS/ASEC data.
Source: Joint Center for Housing Studies tabulations of 1994 through 2015 CPS/ASEC data.
This analysis also shows that among younger adults the gap between the homeownership rates of the 2nd and 3rd-and-higher generations has widened since the Great Recession. The growing gap might be due to compositional shifts within the broad 20-year age cohort in such factors as age, ethnic composition, household composition and income. Alternatively, tightening credit markets might affect the generations differently. This could be particularly important for undocumented members of the 2nd generation. In any case, both the generational gap for younger adults and their recent trend certainly deserve further investigation.
For the broad adult age group over age 45, the story is quite different. Among older adults, the homeownership rates among the 2nd and 3rd-and-higher generations have been essentially equal for the past two decades except for a few years at the height of the Great Recession. The slower entry into homeownership we noted for younger 2nd generation households appears to have simply reflected the timing of the transition from renting to owning, rather than the effects of any structural differences between these two generations. After age 45, the 2nd generation has consistently closed the gap with the 3rd-and-higher over the past two decades. Another way to look at this homeownership data is to follow different birth cohorts of young adults as they age from the 25-44 age group into the 45-64 group. For each of the five-year 2nd generation cohorts under age 45 in 1995, the homeownership rates are lower than the respective cohorts in the 3rd-and-higher-generations. However, by 2015, when each of these cohorts is 20 years older, the homeownership gap between the generations has been completely eliminated (Figures 6 and 7).
Source: Joint Center for Housing Studies tabulations of 1995 CPS/ASEC data.
Source: Joint Center for Housing Studies tabulations of 1995 CPS/ASEC data.
The higher median income of 2nd generation adults above age 45 perhaps provides just the leverage they needed to make up the lost ground. And it is also likely that the older 2nd generation households are more concentrated in locations that have lower homeownership rates than the national average. If we could control for metropolitan location as well, middle-aged 2nd generation age-specific homeownership might well be higher than for the 3rd-and-higher generations. Unfortunately, the CPS/ASEC sample size does not allow such sub-national trends to be observed.
In sum, it is important to underscore that failing to recognize the important age differences between the three generations can lead to erroneous conclusions about levels and trends in income and homeownership. Because the 2nd generation age structure is so young, comparisons that lump adults of all ages together will result in unduly low incomes and homeownership for this group. As the Census report concludes, most 2nd generation U.S. residents surpass their parents’ generation in many measures, particularly education, income and homeownership. Once proper age controls are introduced, they equal or surpass the 3rd-and-higher generations in these dimensions as well.


No comments:
Post a Comment