Thursday, October 27, 2016

PRO Neighborhoods Promote Community Development Finance

by Alexander Von Hoffman
Senior Research Fellow
In response to funding cuts and tight credit triggered by the Great Recession, the nonprofit community development field has turned increasingly to community development financial institutions, or CDFIs, to help finance social programs for low-income people. These banks, credit unions, loan funds, and other entities lend money to improve social conditions in disadvantaged neighborhoods, but many of them are limited in capacity and access to capital.

In 2014, JPMorgan Chase & Co. (JPMC) initiated the Partnerships for Raising Opportunity in Neighborhoods program (PRO Neighborhoods) to provide grants to groups of collaborating CDFIs that devise innovative and efficient ways to inject capital into economically depressed and disinvested neighborhoods. JPMC initiated the program with awards of $33 million over a three-year period to seven groups made up of 26 CDFIs with less than $75 million in net assets. With these grants, JPMC hoped to increase the scale and scope of CDFI lending, encourage the creation of new financial instruments for community development, and stimulate the use of quantitative data in community development programs and planning.

In a diverse set of collaborations, the seven awardees carried out a wide array of programs in communities across the country. These ranged from helping mobile-home residents purchase the land on which they live to lending to homebuyers and small-business owners in predominantly low- and moderate-income Latino communities throughout the Southwest.

With predevelopment financing from Adelante Phoenix! partner Raza Development Fund, Native American Connections developed this site, which is now home to 74 affordable apartments and a 70-bed substance use treatment facility that blends traditional healing practices with evidence-based medicine.

As CDFIs, the awardee collaborations all made loans. Most of these loans went to help owners of single- or multi-family housing or small businesses, but some went to other types of borrowers. For example, one of the collaborations, the Midwest Nonprofit Lenders Alliance, issued facility purchase and improvement loans to nonprofit organizations, including a social service agency, an arts center, and a food provider to the chronically ill.

But the 2014 PRO Neighborhoods awardees engaged in activities other than loaning money as well, including marketing, education and training, and the development of technology. In all, the CDFIs dedicated $6 million of the $33 million in total awards to non-lending activities.

In a new progress report on the first round of PRO Neighborhoods awardees, the Joint Center for Housing Studies found the work of the awardees showed the ability of CDFIs to form diverse types of collaborations, increase financing, and devise novel forms of community development projects. So far, the 2014 PRO Neighborhoods awardees have provided 1,263 loans totaling over $239 million to support low- and moderate-income communities. These loans supported the creation or preservation of 1,616 units of affordable housing and 4,432 jobs, two of the key building blocks of community revitalization.

In addition, the awardees used their grants to attract capital from other sources and thus extend the reach of their lending, one of the main goals of the PRO Neighborhoods program. Taken together, the awardees used $26 million of JPMC capital to leverage an additional $351 million of outside money to support either their own lending or the projects in which they invested.

At the same time, awardees engaged in innovative collaborations. The Chicago CDFI Collaborative, for example, brought together three nonprofit lenders to target a long-standing unmet need in depressed inner-city neighborhoods—rehabilitation of 1–4 unit residential buildings—and to offer financing to support every phase of the rehabilitation process. In the Adelante Phoenix! collaborative, the Raza Development Fund provided guarantees to MariSol Federal Credit Union for its new consumer products, including immigration-aid loans and DREAMer student loans.

A Chicago two-flat residence financed by Community Investment Corporation, a member of the Chicago CDFI Collaborative. Almost half of the affordable housing in Chicago is contained in 1–4 unit buildings such as this one.

As the PRO Neighborhoods Progress Report 2016 report indicates, with sufficient capital, collaborations of CDFIs hold great potential for increasing the scale, scope, and territory of community development lending. Over the next two years, the Joint Center for Housing Studies will continue to follow the progress and challenges not only of the 2014 PRO Neighborhoods awardees but also of the CDFIs collaborations selected for 2015 and 2016 awards. In reports, blog posts, and case studies concerning the PRO Neighborhoods program, we hope to illuminate the possible ways alliances of CDFIs can improve the lives of people living in America’s low-income neighborhoods.

Read PRO Neighborhoods Progress Report 2016

Tuesday, October 25, 2016

Can Homebuyer Counseling Support Sustainable Homeownership?

by Jonathan Spader
Senior Research Associate
HUD recently released a progress report —including a few early findings—from what could be a ground-breaking study of homebuyer education and counseling (HEC). While it will be several more months before the full study sample is ready for analysis, the early findings offer several insights about the value of HEC in helping potential homebuyers prepare for and sustain homeownership. Equally important, they confirm that implementation of the study is on track, successfully completing a field experiment that has the potential to produce detailed evidence about the impacts of homebuyer education and counseling. (Full disclosure: I’m currently an advisor to the study and previously served as its project director.)

The HUD study offers the first large-scale randomized-control trial of homebuyer education and counseling (although existing non-experimental studies  have shown promising estimates of HEC’s impacts). When enrollment closed earlier this year, more than 5,800 study participants were enrolled in 28 cities across the United States, with enrollments primarily occurring between January 2014 and January 2016. These participants were randomly assigned to one of three study groups: 1) in-person HEC offered through local housing counseling agencies; 2) remote HEC offered via internet and telephone, and 3) a no-services control group. For more details about this study design, see the full report

Looking forward, the critical tests will examine how HEC influences recipient outcomes, and whether such impacts translate into improved decisions during the home purchase process and, ultimately, into sustained homeownership. To better understand these impacts, the study’s future analyses will examine multiple measures across three domains: financial knowledge and management; home and mortgage search; and, homeownership sustainability.

For now, the early results offer a few data points that focus on the initial steps toward these outcomes, comparing outcomes 12 months after enrollment for a pooled treatment group (which combines the in-person and remote groups) versus the control group. These early analyses find several statistically-significant impacts of HEC:
  • Treatment group members performed significantly better than control group members on a four-question measure of mortgage literacy.
  • Treatment group members are significantly more likely to indicate that they would proactively contact their lender before missing a payment, a period when the lender has the most options for finding a solution that avoids default or foreclosure.
  • Treatment group members are significantly more likely to have credit scores above 620, suggesting that HEC helped participants to correct errors or otherwise improve their credit scores in advance of home purchase.
Not all of the outcomes showed statistically-significant impacts. Treatment group members were not significantly different than control group members with respect to the fourth outcome tested—whether they regularly tracked their spending against a budget. A further caveat to these findings comes from the preliminary nature of the tests, which are based on a subset of the full study sample and examine only a handful of outcomes. Nonetheless, these estimates offer initial evidence that homebuyer education and counseling can play a valuable role in helping people prepare for homeownership. To that end, the early results report includes a couple of statements from study participants that are worth quoting directly:

“Just talking to the [housing counselor], it made me realize… what I could afford and, well, what I was preapproved for… She was adding on other expenses that I had totally forgot to add, you know, ‘cause I thought I had it all together. And I hadn’t. So I ran into a few things talking to her that made me realize that I probably need to just, you know, wait.”
 –Study participant in Chicago, IL

“[HEC] gave us the idea of whether we should go for it right now or not. It is really telling us what the timing [sic] if we are not really prepared and if we don’t have enough credit or other issues …you know, maybe it is not the right time for us. So it is really helping us to make the decision of go or no go.”
–Study participant in Dallas, TX

The full analyses of study participant outcomes at 12 months from study enrollment are is due in 2018, with analyses of longer-term impacts at 42 months from enrollment due in 2020. If the initial results are any guide, these future reports are likely to offer important conclusions about the value of HEC in supporting sustainable homeownership. 

Thursday, October 20, 2016

Growth in Remodeling Spending Projected to Peak in 2017

by Abbe Will
Research Analyst
Strong gains in home renovation and repair spending are expected to continue into next year before tapering, according to our latest Leading Indicator of Remodeling Activity (LIRA) released today. The LIRA projects that annual growth in home improvement and repair expenditures will continue to increase, surpassing eight percent by the second quarter of 2017 before moderating somewhat later in the year.

Homeowner remodeling activity continues to be encouraged by rising home values and tightening for-sale inventories in many markets across the country. Yet, a recent slowdown in the expansion of single family homebuilding and existing home sales could pull remodeling growth off its peak by the second half of 2017.

Even as remodeling growth trends back down, levels of spending are expected to reach new highs by the third quarter of next year. At $327 billion annually, the homeowner improvement and repair market will surpass its previous inflation-adjusted peak from 2006.


For more information about the LIRA, including how it is calculated, visit the JCHS website.

NOTE ON LIRA MODEL: As of April 21, 2016, the LIRA has undergone a major re-benchmarking and recalculation in order to better forecast a broader segment of the national residential remodeling market. For more information on this, see our earlier blog post, and read the research note: Re-Benchmarking the Leading Indicator of Remodeling Activity.

Thursday, October 6, 2016

Housing Recovery by Income in Two Metros: San Francisco and St. Louis

by Alex Hermann
Research Assistant
The increases in home prices that have occurred since the Great Recession not only vary across the nation’s metropolitan areas, they also vary within many metros as well. The San Francisco metropolitan area, where home values are now 16 percent above their pre-recession peak, and the St. Louis metropolitan area, where home values are still 10 percent below their pre-recession peak, illustrate these variations.

In both areas, median home prices in low-income ZIP Codes are less likely to exceed mid-2000 peaks than median prices in high- and moderate-income ZIPs. However, the regions vary when looking at the changes in house prices between 2000 and 2016. Over that time period, the percentage increase in median prices in the Bay Area’s low-income ZIPs was greater than the increases in high- and moderate-income ones. In contrast, the percentage increase in St. Louis’ low-income ZIP Codes was much smaller than the increase in that region’s high- and moderate-income ZIP Codes. (In this analysis, low-, moderate-, and high-income ZIP Codes have a median household income under 80 percent, between 80 and 120 percent, and above 120 percent of their state’s median income, respectively.)

Changes in home price also vary within both metros. For example, metropolitan San Francisco has had the eighth strongest post-recession recovery in home prices. As a result, median home values in San Francisco’s high-income ZIP Codes are about $1.18 million dollars while the median value in low-income ones are $586,000, more than three times the median price for the U.S. as a whole, which is $186,500.

However, home values in many of the region’s ZIP Codes are still below their pre-recession peak (Figure 1). In all, 31 of San Francisco’s 142 ZIPs, or 22 percent, have yet to regain their mid-2000 peaks, including:

  • 50 percent (5 of 10) of low-income ZIPs
  • 35 percent (12 of 34) of moderate-income ZIPs, and
  • 14 percent (14 of 98) of high-income ZIPs.

 Click to enlarge
Source: JCHS tabulations of Zillow Home Value Index data and ACS 2014 5-year data

Most ZIP Codes that have not regained their peak median home values are located on the outskirts of Metro San Francisco, particularly in northern Contra Costa County. That area is home to 10 of the 14 high-income ZIP Codes where median prices have not exceeded their pre-recession peak as well as 8 of the 12 moderate-income ones and three of the five low-income ones. Most of the remaining ZIP Codes where prices are still below pre-recession peaks are in the urban areas south of Oakland along the East Bay, which includes many low and moderate-income ZIP Codes as well as two high-income ones.

Although prices in San Francisco’s low-income ZIP Codes are less likely to regain their pre-recession peaks, the trend is different when examining price changes since 2000. Overall, home values increased in all the region’s ZIP Codes. But on a percentage basis, the values in low-income ZIP Codes increased more rapidly than those in high-income areas (Figure 2).

 Click to enlarge
JCHS tabulations of Zillow Home Value Index data and ACS 2014 5-year data

The story is somewhat different in metropolitan areas that have not seen San Francisco’s rapid price appreciation, such as St. Louis, where home values in June 2016 were still 10 percent below their pre-recession peak. There, median prices exceeded their peaks in only 27 of 147 ZIP Codes, most of them located in the region’s urban core and suburban Madison County. (Figure 3). These unrecovered areas include:

  • 1 of 35 (3 percent) low-income ZIPs
  • 6 of 55 (11 percent) moderate-income ZIPs, and
  • 20 of 57 (35 percent) high-income ZIPs.

 Click to enlarge
JCHS tabulations of Zillow Home Value Index data and ACS 2014 5-year data

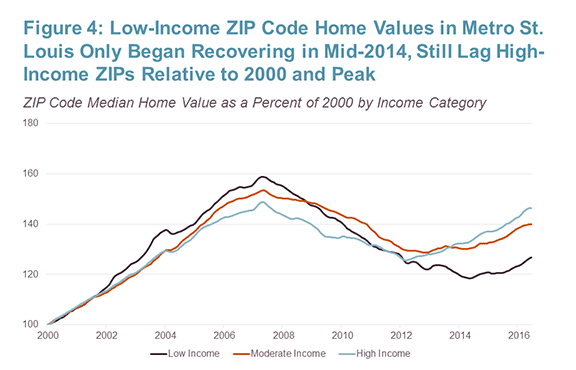
Moreover, unlike San Francisco, prices in low-income ZIP Codes in St. Louis have grown only modestly since 2000 and have increased much less than those in high- and moderate-income ZIP Codes. In the run-up to peak, prices in low-income ZIP Codes grew only marginally faster than prices in high-income ZIPs. Additionally, the post-recession upturn in home values in low-income ZIPs lagged the increase in high-income ZIP Codes by nearly two years (Figure 4).

 Click to enlarge
JCHS tabulations of Zillow Home Value Index data and ACS 2014 5-year data

What to take away from this analysis? Overall, home values in high-income ZIP Codes have outpaced home-value gains in low-income ZIPs since the price peak of the mid-2000s. When taking a broader view, low-income ZIP Codes have performed as well as high-income ZIPs since 2000 in fast-appreciating markets like San Francisco, while in many lagging markets, like St. Louis, home value gains in high-income ZIPs have typically surpassed those in low-income ZIPs. Furthermore, though income levels are important they are not determinative. The geographic patterns also underscore the fact that trends in home values are also a function of features such as density and proximity to the central city.

These relationships, and others, will be discussed in a forthcoming Joint Center working paper on home value trends since 2000.