Showing posts with label AHS. Show all posts

Wednesday, March 15, 2017

Remodeling Activity Projected to Grow in Most Metropolitan Areas

by Elizabeth La Jeunesse
Research Analyst
Spending on home improvements is expected to increase this year in 43 of the nation’s 50 largest metropolitan areas, according to our latest report about the home improvement industry, Demographic Change and the Remodeling Outlook. The report projects that, on average, home improvement spending in 2017 in these metro areas will be 6.8 percent higher than it was in 2016, slightly more than the projected 6.1 increase nationwide. 

However, as an interactive map released in conjunction with the report shows, the growth rates will vary widely. About a third of major metro areas are expected to see strong growth of 10 percent or more, while a similar number should see declines or slow growth of under 3 percent.


Some of the largest increases, in percentage terms, are expected to occur in several Midwestern metropolitan areas such as Cincinnati, Cleveland, Columbus, Kansas City, Minneapolis, and Milwaukee, where there is a consistent demand for housing and prices are not as high as in other parts of the country.

Double-digit gains in home improvement expenditures are also expected in New England’s three largest metro areas—Boston, Hartford, and Providence—where home sales have been strong. While average per-owner spending in other metropolitan areas on the East Coast has been relatively high in recent years, total spending in several of those areas is expected to increase slowly in the next year. The report projects that spending will grow by less than one percent in New York, the nation’s largest metro area, and by less than four percent in the Washington, DC area.

Home improvement spending is also expected to pick up significantly in several fast-growing, Southern metropolitan areas where homebuilding activity has revived and more households are forming, such as Atlanta, Charlotte, Jacksonville, and Orlando. In contrast, spending will grow modestly or may even decline in Southern metro areas with oil-dependent economies such as Dallas, Houston, and Oklahoma City.

On the West Coast, the report projects a significant increase in spending on home improvements in the Sacramento metro area, where house prices recovered more slowly from the Great Recession than in other parts of the state. In contrast, spending is expected to increase only modestly or decline slightly in the Los Angeles, San Diego, San Francisco, and San Jose, where leading indicators suggest housing markets may be approaching their cyclical peaks. In metro areas across the Mountain and Pacific Northwest regions, growth rates are also expected to vary widely, from a low of just under 2 percent in the Las Vegas metro to a high of nearly 10 percent in the Salt Lake City area.

These projections are based on two measures of housing demand—single-family starts and growth in existing home sales—that are strong leading indicators of national remodeling activity. The results broadly support our expectation that home improvement expenditures in certain high-cost markets may soon reach a cyclical peak, while spending will increase in markets where house prices are lower but are increasing steadily.

The report also finds that the national market for home improvements is somewhat more concentrated in the nation’s 15 largest metropolitan areas, which account for about 29 percent of the nation’s homeowners. Illustratively, according to estimates from the 2015 American Housing Survey, average per-owner improvement spending in the same 15 metro areas was $3,500, or more than 30 percent greater than average spending by homeowners outside of these areas. As a result, aggregate spending by homeowners in the same 15 areas totaled over $80 billion, or nearly 37 percent of the total spending by all owners on home improvements nationally.

Thursday, January 19, 2017

New Benchmark Data Modestly Lowers Remodeling Market Size Projections

by Abbe Will
Research Analyst
The Joint Center’s Leading Indicator of Remodeling Activity (LIRA) provides a short-term outlook of national home improvement and repair spending to owner-occupied homes and is benchmarked to national spending estimates from the Department of Housing and Urban Development’s American Housing Survey (AHS). The latest LIRA release projects national spending for home remodeling and repairs will grow to $317 billion in 2017, an increase of 6.7 percent from last year. This LIRA release also updates and revises historical spending levels and growth due to the incorporation of newly released historical benchmark data from the 2015 AHS. Compared to last quarter’s LIRA release, the updated LIRA now shows lower and less cyclical growth in homeowner improvement and repair spending in 2014 and 2015, a somewhat lower market size estimate, and also more modest projections for remodeling market growth in 2017. According to Joint Center tabulations of the AHS, spending in 2014 and 2015 was not quite as robust as the LIRA model predicted, growing 11.3 percent from $250 billion in 2013 to $278 billion in 2015 compared to LIRA estimated growth of 14.3 percent over this time period. As seen in Figure 1, the lower growth in remodeling spending in 2014 and 2015 has implications for the size of the market projected by the LIRA model for 2016 and 2017.

Notes: Data for 2014 and 2015 are based on estimates from the 2015 American Housing Survey. Data since 2016 are modeled by the LIRA. Source: Joint Center for Housing Studies.

Previously, the LIRA estimated a homeowner improvement and repair market size of $305 billion in 2016 and projected spending growing to $326 billion by the third quarter of this year. Now with the replacement of AHS-based benchmark data for previously modeled benchmark estimates, the LIRA model indicates remodeling activity reached $297 billion in 2016 and projects spending will reach $317 billion this year. The implication of slightly slower growth in actual remodeling and repair spending is a reduction in market size projections for 2017 of 2.9 percent or $9.5 billion. Incidentally, the more modest growth projected by the LIRA for 2017 compared to the prior release is not related to the addition of the new historical benchmark data. The LIRA projections revise routinely as the year-over-year trends in the LIRA inputs are updated or revised.

The weighted average of the LIRA inputs produces the LIRA estimates and projections as seen in Figure 2A (for modeling improvements spending trends) and Figure 2B (for modeling maintenance and repair spending trends) compared to the now updated AHS-based benchmark data series for 1994-2015. The improvements LIRA continued to track the reference series very closely in 2014 and 2015. The estimates produced by the improvements LIRA model and the AHS-based benchmark now have a correlation coefficient of 0.84 (p-value of 0.00). And a simple regression of the LIRA output on the benchmark spending series results in an R-squared value of 0.6759, which suggests that upwards of 70% of the variation, or movement, in the improvements spending benchmark can be explained by the LIRA model.

Sources: JCHS calculations using HUD, American Housing Surveys; Department of Commerce, Retail Sales of Building Materials; and US Census Bureau, Construction Spending Value Put in Place (C-30); Leading Indicator of Remodeling Activity.

Similarly, Figure 2B compares the weighted average output of the maintenance and repair LIRA model to its AHS-based reference series. The maintenance LIRA has also tracked its benchmark fairly well since 2013. The maintenance and repair LIRA and its reference series have a correlation coefficient of 0.73 (p-value of 0.00) and a simple regression of the LIRA output on the benchmark results in an R-squared value of 0.5362, which suggests that about 54% of the movement in the home maintenance and repair spending benchmark can be explained by this LIRA model.

Sources: JCHS calculations using HUD, American Housing Surveys; Department of Commerce, Retail Sales of Building Materials; and US Census Bureau, Survey of Residential Alterations and Repairs (C-50); Leading Indicator of Remodeling Activity.

Last spring, the LIRA was re-benchmarked to a measure of home improvement and repair spending based on estimates from HUD’s biennial American Housing Survey, and at that time, historical remodeling and repair data from the AHS was available for 1994–2013. Until the 2015 AHS data became available, the LIRA model was used to estimate historical improvement and repair spending levels since 2013. Once every two years, with new historical AHS data, the LIRA benchmark series will be updated. With the January 2017 release, the LIRA model will be used to estimate historical spending levels since 2015 until the next biennial release of the American Housing Survey allows for actual 2016 and 2017 spending data to replace modeled estimates.

More information and analysis of recent and expected trends in home improvement and repair activity will be forthcoming in the Joint Center for Housing Studies’ latest biennial Improving America’s Housing report to be released on Tuesday, February 28th.

Thursday, August 11, 2016

Are Renters and Homeowners in Rural Areas Cost-Burdened?

by Sonali Mathur
Research Assistant
As our latest report and interactive map illustrate, housing affordability is one of the biggest challenges faced by owner and renter households in most metro areas across the US. However, maps that use metro areas to display the local-level story miss the fact that cost burdens are also a major concern in non-metro/rural areas and are severely high for millions of low-income rural households. To address this gap in visibility, we created a set of interactive maps (Figure 1) using 2010-2014 American Community Survey (ACS) estimates. In doing so, we found that housing cost burden rates in some rural counties are significant. We also learned that rural counties of the Northeast and west, that are adjacent to high-cost metros, have even higher cost burden rates than those in parts of the Midwest.

 (Click to launch interactive map; may take a moment to load.)

Housing cost burdens are particularly stark for rural renters. Indeed, fully 41 percent of all rural renters are cost-burdened (meaning they spend 30 percent or more of their income on housing), including 21 percent who are severely cost-burdened (spending 50 percent or more of their income on housing). Among owners, 22 percent are cost-burdened including nearly 9 percent who are severely cost-burdened. Overall, nearly 5 million rural households pay more than 30 percent of their monthly income toward housing and more than 2.1 million rural households spend more than half of their income on housing.

And cost burdens have been growing in rural areas (Figure 2). Since 2000, housing costs in rural areas have increased over 5 percent and one in every four rural households is now cost-burdened. Comparing burden rates from 2014 to those from 2000 in the maps above shows the increasing cost burdens in many rural areas over the last decade, including areas in and around the traditional Black Belt counties of the Southeast and areas in the west and Northeast that are contiguous to areas that had high cost burdens in 2000.

Source: JCHS tabulations of US Census Bureau, American Community Survey 2010-2014 and census 2000 for all non-metropolitan census tracts. 

Rural affordability issues tend to receive less attention due to a perception that housing costs are lower in rural areas, which is true as compared to metro areas. According to the 2013 American Housing Survey (AHS) the median monthly rent in metro areas is $800, while the median monthly rent in non-metro areas is $530. Monthly owner costs are also fully 43 percent lower in non-metro areas than in metro areas. However, low incomes and poverty are prevalent in rural areas. According to estimates from the American Community Survey, fully 15 percent of all households in non-metro area census tracts earn less than $15,000 annually and nearly 36 percent earn less than $30,000. Poverty is a widespread problem in rural areas, with 18 percent of population living in poverty compared to 15 percent in metro areas.

In addition to poverty and affordability, rural areas face several other major housing challenges. The share of housing stock that would be considered inadequate, as measured by the number of units lacking complete plumbing or a complete kitchen, is higher in non-metro areas. The share of units lacking complete plumbing is 4 percent in non-metro areas, compared to 2 percent nationally.

Among units in non-metro areas that lack complete plumbing facilities, 10.3 percent also have more than one occupant per room (compared to 8.2 percent in metro areas). This suggests that in non-metro areas there is likely to be overcrowding in the same units that lack adequacy. It is probable that the households facing affordability problems are dealing with it alongside other issues.

While it is true that cost burdens are high and a growing problem in most metro areas across the country, it is important to remember that non-metro areas also face increasing housing affordability issues, in addition to other housing-related challenges and should not be forgotten in policy discussions of a comprehensive approach to the escalating housing affordability problem.

Thursday, April 21, 2016

Robust Remodeling Growth Anticipated by Re-Benchmarked LIRA

Abbe Will
Research Analyst

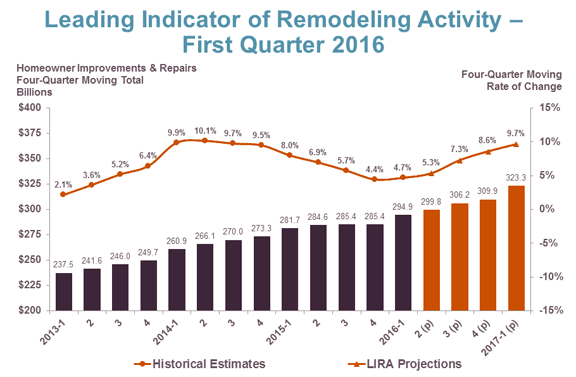
Strongly accelerating growth in home improvement and repair spending is expected heading into 2017, according to the newly re-benchmarked Leading Indicator of Remodeling Activity (LIRA) released today. The new and improved LIRA projects that home remodeling spending will increase 8.6% by the end of 2016 and then further accelerate to 9.7% by the first quarter of next year.

Ongoing gains in home prices and sales are encouraging more homeowners to pursue larger-scale improvement projects this year compared to last with permitted projects climbing at a good pace. On the strength of these gains, the level of annual spending for remodeling and repairs is expected to reach nearly $325 billion nationally by early next year.

Notes: The former LIRA modeled homeowner improvement activity only, while the re-benchmarked LIRA models home improvement and repair activity. Historical estimates are produced using the LIRA model until American Housing Survey data become available.

Source: Joint Center for Housing Studies.

Our freshly recalibrated indicator now forecasts a broader segment of the national residential remodeling market that includes both improvement and repair activity to the owner-occupied housing stock. With this re-benchmarking, the LIRA now more accurately sizes the remodeling market and continues to anticipate major turning points in the spending cycle.

For more information about the LIRA, including how it is calculated, visit the Joint Center website.

Note on the LIRA model: As of April 21, 2016, the LIRA has undergone a major re-benchmarking and recalculation in order to better forecast a broader segment of the national residential remodeling market. For more information on the implications of this change, see our earlier blog post, and read the research note:
N16-4: Re-Benchmarking the Leading Indicator of Remodeling Activity.

Monday, April 18, 2016

Greater Coverage of Flourishing Home Improvement & Repair Market Reflected in Center’s Re-Benchmarked Leading Indicator of Remodeling Activity

Abbe Will
Research Analyst

On Thursday, April 21, the Joint Center will release a newly re-benchmarked leading indicator that projects short-term trends in the broader home improvement and repair market. This re-benchmarking and recalculation of the Center’s Leading Indicator of Remodeling Activity (LIRA*) provides three major enhancements over the former LIRA that the Center has produced since 2007:
  • More accurate reflection of the true size of the home remodeling market: The re-benchmarking provided an opportunity to better align the LIRA reference series with a more comprehensive remodeling market size that now includes maintenance and repair spending to owner-occupied homes, in addition to improvement spending—at present a nearly $300 billion market for homeowner spending alone.
  • Updated drivers of home improvement and repair activity as industry emerges from the Great Recession: The housing and home improvement markets have gone through possibly the most severe cycles in their recorded histories since the LIRA was first released, necessitating a review of the original LIRA model and inputs for accuracy.
  • Better reflection of historical spending patterns by homeowners: A major motivation for this re-benchmarking has been the declining quality and reliability of the LIRA’s former benchmark data series, which has been subject to unusually large revisions to its cyclical trend in recent years (see previous blog post on this topic). 

The regularly scheduled release of the LIRA later this week will also include a Research Note* describing the re-benchmarking motivations and methodology and revisions to the LIRA model inputs in detail. Moving forward, the LIRA will be benchmarked to a measure of home improvement and repair spending based on estimates from the Department of Housing and Urban Development’s biennial American Housing Survey. Including home maintenance and repair activity results in a somewhat less cyclical LIRA than previously, but ultimately the re-benchmarked LIRA still anticipates turning points in the market well (Figure 1).

 click to enlarge
Notes: The most recent data available from the American Housing Survey is 2013. LIRA data only include historical estimates produced by the model. Regular quarterly LIRA releases will project with a time horizon of four quarters.
Source: Joint Center for Housing Studies


Major enhancements to the LIRA model inputs include measures of house prices and residential remodeling permits that together with traditional inputs, such as retail sales of building materials and home construction and sales, are expected to better predict post-Great Recession market trends for the remodeling industry (Figure 2).

 click to enlarge
The re-benchmarked LIRA, measured as an annual rate-of-change of its component inputs, provides a short-term outlook of national homeowner improvement and repair activity for the current quarter and subsequent four quarters, and is intended to help identify future turning points in the business cycle of the home remodeling industry. The LIRA is released by the Remodeling Futures Program at the Joint Center for Housing Studies of Harvard University in the third week after each quarter’s closing. The release of the First Quarter 2016 Leading Indicator of Remodeling Activity is set for 9:00 AM ET on Thursday, April 21. 

--
*Note - links will be updated Thursday with the release and publication of the research note

Wednesday, May 20, 2015

The Rise of the Single-Person Household

by George Masnick
Senior Research Fellow
Perhaps nothing speaks greater volume about changes in modern American life than the rise of the single-person household. A recent paper authored by Census Bureau researchers shows that a hundred years ago, fewer than six percent of all households consisted of people who lived alone. By 1940, that share had only inched upward to 7.8 percent. By 2013, at 28 percent of all households, it is now the second most common household type just behind married couples without minor children (29 percent), and well ahead of marrieds with minor children in the household (19 percent). In the 19th and early 20th centuries, single-person households consisted mostly of men, but the greatest gains in living alone during the past 50 years have been among women. Today, women head 54 percent of all single-person households. In the past, when living alone might have been a short-term condition, for many it is now a long-term situation, the result of a number of broad demographic and economic forces at work over the past half century: greater affluence, longer lives, later ages of marriage, higher divorce, smaller family sizes, greater labor force participation and financial independence of women, and stronger government safety nets across a wide spectrum of social programs.

In parts of the country the share living alone is much higher than the national average. In many counties in the nation’s mid-section, where outmigration of young adults have led to older populations, between 30 and 40 percent of all households are single person. In large cities, single person occupancy can account for 45 percent of all households. A Pew Research Center study of single-person households reports that in some neighborhoods in Manhattan and DC, the share of single-person households approaches two thirds. 

According to the 2013 American Housing Survey, single-person households are spread across all ages. About 28 percent of all single person households are under the age of 45, another 36 percent between the ages of 45 and 64, and 36 percent are over the age of 65. Among the elderly, the older the household head, the higher the percentage that live alone. Fully 43 percent of households headed by those over the age of 65 are single-person, with 65-69 year old heads having 34 percent, 70-74 year olds at 37 percent, and 75+ registering 52 percent. Aging baby boomers will drive the share of over-65 year olds living in single-person households even higher over the next two decades. 

As recently as 1940, 61 percent of single-person households consisted of renters, but today owners are in the majority, with the 2013 American Housing Survey reporting that 54 percent of single person households were owner-occupied. Between 2003 and 2013, owners accounted for 55 percent of the growth in single person households. Among single-person households under the age of 45, two thirds are renters, but among single-person households over the age of 65, owners are a strong 70 percent majority (Figure 1).


Source: Joint Center tabulation of 2013 American Housing Survey

Single-person owners and renters are markedly different in terms of the type of housing they occupy. Fully three quarters of single-person renters live in multi-family housing, but among single-person owners almost three quarters live in single-family detached units, and another 8 percent in single-family attached structures. Single-person owners also live in larger units, with 63 percent in homes with 3+ bedrooms. This compares to only 12 percent of single-person renters living in large units (Figure 2).

Source: Joint Center tabulation of 2013 American Housing Survey

The reason that more single-person owners live in larger units compared to single-person renters is that many widows and divorcees remain in their homes after life-course events have left them living alone. Almost three-quarters of single-person owners have been in their homes for 10 or more years, including 40 percent who have been there for 20 or more. This compares to only 16 percent of single-person renters having lived in their homes for 10 or more years. Among single-person owners over the age of 65, 59 percent have been in their home for 20 or more years and another 21 percent for 10-19 years. 

Of course, not all single-person owners have lived alone the entire time in the home they now occupy. While for many, living alone might be a relatively recent event; for others it has become a long-term situation. When becoming single in late middle-age, such as when adult children of divorcees leave home, or when a spouse dies at a relatively young age, staying put has many advantages - including a neighborhood support network, familiar routines, and an overwhelming need for some stability in at least this one dimension of a life that has been turned upside down. But for many, the longer one lives alone and the older one gets, the more difficult it becomes to make a housing adjustment that might make sense across a wide spectrum of criteria.

Because young and middle-aged adults who live alone are more likely to be renters and to have lived in their homes for shorter periods of time, they are most likely to have chosen a house or apartment that best meets their current needs - in location, tenure, size, and cost.  This could also be said of elderly renters who are more mobile than elderly owners.  Elderly owners, however, who have lived in their homes for many years, are more likely to be living in places that were more suitable to when they were married or had young children. A recent Joint Center report highlights housing issues faced by many older adults as they age in place, including housing cost burdens and a lack of accessibility features in homes that are increasingly important as they faces health and mobility issues. While that report did not focus on older single-person households in particular, many of the concerns that were raised for all elderly are magnified for this group as they lack a partner or companion who can help both financially and physically.

In general, housing markets in this country respond fairly quickly to changes in demand. The upturn in multi-family construction following the Great Recession is a case in point.  However, one area where housing markets have been slow to respond is to fill the demand for smaller, affordable single-family owned units that are geared to the older homeowner in communities where the elderly now live. Land cost and availability, regulatory constraints, high property tax rates, proximity to shopping and services, and difficulties accessing public transportation are all obstacles to building such housing where many elderly now live and wish to continue to live. Unless these obstacles can be overcome, aging in place will continue to increase the number of elderly who live alone in homes that are too large and costly to maintain, requiring being able to drive to shop and get to necessary services, and perhaps unsafe and difficult to navigate when health and mobility begins to deteriorate.

Thursday, August 21, 2014

Older Homeowners Want to Age in Place but Aren't Focused on Accessibility

by Abbe Will
Research Analyst
With many baby boomers reaching retirement age this decade, a major shift in the age distribution of U.S. households is underway. According to recent Joint Center projections, the number of householders age 65 and over is set to increase by 9 million from 2010 to 2020. Many of these older adults will choose to remain in their current homes and “age in place” while others will look to move into homes that are better suited to their changing needs. New survey data from The Demand Institute—a joint venture between The Conference Board and Nielsen—sheds light on homeowner attitudes toward aging in place and accessibility needs, including major motivations for upcoming remodeling projects. This extensive survey, fielded in the summer of 2013, asked households about their housing attitudes, household finances, major household purchases, community and commuting, future moving intentions, housing and neighborhood needs, and home improvement plans and motivations.

A preliminary analysis of the Demand Institute’s consumer housing survey data indicates that older homeowners do not consider aging in place and home accessibility as going hand in hand. Although the vast majority of homeowners age 50 and over report that being able stay in their home as they age is very important (88 percent ranked this statement 8, 9, or 10 on a scale of 1 to 10, where 10 is extremely important), less than 35 percent of older owners place the same level of importance on having a home that is accessible to persons with special health needs or disabilities.

Indeed, 7 out of 10 older homeowners do not have any plans to move in the future, meaning they intend to age in place. But even among those who do plan to move at some time in their later years, only 36 percent cite accessibility as an important characteristic of their next home. This is a meaningful statistic given that the 2011 American Housing Survey estimates that almost 30 percent of older homeowners have a disability or significant difficulties doing typical activities around the home without assistance, which would indicate some need for home accessibility features. The share of homeowners with disability or impairments rises dramatically with age to 46.4 percent of homeowners age 70 or older.

Unfortunately, older homeowners are largely not focused on accessibility needs as part of aging in place. While 45 percent of older owners report being somewhat or very likely to do a major remodeling project (costing $2,000 or more) on their primary home in the next three years, few of them are likely to list “accommodating health needs” or “making the home easier to live in as they age” as major reasons for their next renovations. Only 8.0 percent of homeowners age 50 and over who plan to do a major remodeling project in the next three years plan to do so to accommodate the health needs of someone in the household, and only 15.3 percent want to renovate specifically to make their home easier to live in as they age. Even those older owners reporting that accessibility is important to them are not much more likely to cite accessibility (16.0 percent) and aging in place (23.4 percent) as major reasons for upcoming remodels.


Notes: Major renovations are defined here as costing $2,000 or more.  Homeowners placing high importance on accessibility ranked having a home that is accessible for people with special health needs or disabilities as 8, 9, or 10 on a scale of 1 to 10 where 10 is “extremely important.” Source: JCHS tabulations of the Demand Institute’s 2013 consumer housing survey data.

Certainly as the number and share of older households increase significantly in the coming decades, the demand for homes with accessibility features for safely aging in place will also grow substantially. Yet, given the attitudes of today’s older homeowners, the remodeling industry will need to bridge a significant gap between owners wanting to age in place and being able to do so safely with appropriate accessibility features.


On Tuesday, September 2, the Harvard Joint Center for Housing Studies and AARP Foundation will release a new report, Housing America's Older Adults—Meeting the Needs of An Aging Population, which will look at these and other issues affecting America's aging population.

Join us for the live webcast at 11:00 a.m. (Eastern) on September 2, and follow the conversation on Twitter with #housing50.

Thursday, July 17, 2014

Interactive Map: Where Can Renters Afford to Own?

by Rocio Sanchez-Moyano
Research Assistant
Homebuyer affordability remains near an all-time high, so where are all the first-time homebuyers? According to indexes that incorporate gross measures of house prices, interest rates, and household incomes, affordability remains at unprecedented levels. The National Association of Realtors® index, for instance, shows that the median-income household can afford to buy a home in all but 7 percent of the largest metros. Given that affordability looks good on paper, the lack of first-time homebuyers in all metros has been surprising. In 2013, first-time homebuyers made up 38 percent of home purchases, below the historical average of 40 percent, dating back to 1981. The most recent American Housing Survey shows that 3.3 million households were first-time buyers in 2009-2011, a 22 percent drop from the 2001 survey, which covered 1999-2001. This decline in first-time buyers comes in spite of real mortgage payments for the median home that remain below $800 (levels unprecedented before the recession) and a 7 percentage point decline in the mortgage payment-to-income ratio since 2001.

Affordability indexes typically use median home prices and median incomes to estimate affordability, but it can be difficult to calculate the number of potential first-time buyers from these indexes, as median incomes differ for renters and owners and across age groups. To better estimate affordability for potential first-time homebuyers, the JCHS looked at how many renters in the age group most likely to be first-time homebuyers (25-34) have enough income to afford the costs of owning in different metro areas. Analysis was performed on the top 100 metros by population for which National Association of Realtors® quarterly median existing single-family home price data was available, resulting in 85 metros included in the final analysis. Affordability in this analysis is defined by the maximum debt-to-income ratio established in the Qualified Mortgage (QM) rule that went into effect in January of this year. The median home is considered affordable in this analysis if mortgage payments, with a 5 percent downpayment (more typical for first-time buyers), property taxes and insurance, and non-housing debt payments make up no more than 43 percent of a household’s income (extended metholodogy).

Historically, the majority of first-time buyers are households aged 25-34. Looking at renters in this age group, most would find the monthly costs of homeownership affordable in many metros across the country. Indeed, in 42 of the 85 metros studied, more than half of renters can afford the monthly costs of homeownership. Nearly 30 percent of the 25-34 year old renters in our sample lived in these affordable metros. Only in six metros, concentrated almost exclusively in California, are renter incomes so low compared to house prices that less than 30 percent of renters aged 25-34 can afford the costs of owning.

Click to launch interactive map


So why, given that so many metros are affordable to potential 25-34 year old first-time buyers, has the first-time buyer share remained low? Many demographic and economic forces are constraining the transition to homeownership for renters in their 20s and 30s. The first is the fundamental mismatch between incomes and prices as shown in this analysis. Even in the metros where the majority of renters 25-34 could afford monthly homeowner costs for the median home, more than one-third of renters in this age group cannot. Real renter income for households aged 25-34 remains at some of its lowest levels in more than a decade. The unemployment rate for this age group peaked above 10 percent in 2010 and stayed above 7 percent throughout 2013. Also, as we indicated in our recent State of the Nation's Housing report, an additional 2.4 million households in their 20s and 30s were living with their parents in 2013 (than if the share living at home had remained at 2007 levels). Aside from covering monthly homeowner costs, unemployment and income stagnation mean that even in the lowest-cost metros in this analysis, many potential buyers cannot afford at least $5,000 for a 5 percent downpayment. Finally, 39 percent of 25-34 year old households have student loan debt and often allocate a larger share of their monthly income to student loan payments than older households. As the economy improves, however, there should be more willingness and ability by these households to become first-time buyers.

Thursday, January 30, 2014

Although the Population is Rapidly Aging, Young Adults Will Still Drive the Demand for New Housing

by George Masnick
Fellow
Hardly a day goes by when we are not reminded about how rapidly our population will age over the next several decades as the baby boom crosses the 65+ threshold.  For housing analysts, an aging population is often thought of as the key demographic trend that will drive housing consumption over the next 20 years.  This shift in age structure does not, however, mean that elderly population growth will be the primary driver of the demand for newly built housing.  While most of the population growth will take place among the elderly, that increase, for the most part, does not represent people active in the housing market. Younger age groups will not experience much population growth, but this is because, among those under 35, large cohorts are replacing other large cohorts – sometimes a bit smaller and sometimes a bit bigger.  But most of the members of these large younger cohorts will enter the housing market for the first time in their 20s and 30s.  They will consume most of the newly built housing.  Here are the details.

The aging of the United States population is dramatically shown in Figure 1.  Between 1970 and 2010, most adult population growth took place in the under 65 age groups.  Starting in 2010, aging baby boomers begin to shift most of the population growth to the over 65 age groups.  Each decade during the past 40 years (the leading edge of the baby boom, those born 1946-1955) has provided the biggest share of population growth of any 10-year age group (lower panel of Table 1 cells highlighted in yellow).  In the 1970s, baby boomers created growth among young adults, gradually shifting the growth to older and older age groups in successive decades.  The dominance of baby boomers in the population growth equation will persist until sometime after 2030 when they begin to reach the end of their lives in large numbers.

Source: Decennial Census data and Census Bureau 2012 Middle Series Population Projections.


Notes: Shaded cells represent largest 10-year cohort in each decade (green) and largest growth (yellow).
Source: Decennial Census counts and 2012 Census Bureau middle series population projections.

Many are quick to conclude that, since population growth drives most of the demand for new housing construction, we must primarily build for the elderly.  The problem with this logic is that elderly population growth does not represent new additions to the population, and most elderly are already housed quite comfortably and show little inclination to move to a different residence. Strong elderly population growth is simply the aging of a large cohort replacing the smaller cohort that came before them - they are not new people entering the housing market.  As I’ve discussed in a previous post, for the remainder of this decade and the next, elderly baby boomers will largely age in place.  Fewer than 4 percent of the population over the age of 65 changed residence in 2012-13.  Over 80 percent of the elderly live in owner-occupied housing.  For those 65+ living in owner-occupied housing, the annual mobility rate is now about 2 percent.


As I mentioned earlier, movers can be thought of as driving the demand for new housing since non-movers by definition stay in their current homes.  While the number of people over age 65 is growing rapidly, given the very low mobility rates of this population the number of movers that are elderly will still be small.  Multiplying the average size of each 10-year age group of adults (upper panel of Table 1) by the average percentage who change residence each year will give the annual number or persons in each age group that are expected to move over the decade.  In the 2000-2010 decade, these movers, or recent occupants, were clearly dominated by young adults age 25-34 (Figure 3).  This cohort does not have the largest population; it is about 5 million less in number compared to the baby boomers age 45-54 in 2010 (upper panel of Table 1). But at over 40 million, its size is substantial.  Having the highest rate of geographic mobility, 25-34 year olds accounted for almost three times as many recent occupants during the 2000-2010 decade as the largest baby boom cohort.  Each year during that decade, persons over the age of 65 averaged only 6.2 percent of total moves (8.5 percent in 2013).  Such low representation of the elderly among movers will persist for the foreseeable future. That share is projected to increase only slightly during the next two decades to an average of about 10 percent in 2020-2030 in spite of the large projected growth in the 65+ population.  Note that these projections likely bias upward the estimates of demand for new market housing by the elderly because the resident population used as a base in the projections include the elderly living in nursing homes and prisons.


Notes: Recent Occupancy numbers = average number of persons in age group during decade x average annual age-specific annual mobility rate.  Number of persons is average of numbers at beginning and end of decade.  Average annual mobility rate is the mean of the age-specific rates at the beginning and end of decade. Projections hold mobility rates constant at 2013 levels.
Source: see Table 1 and Figure 2.

In keeping with their lower mobility rates, older adults are underrepresented in newly built housing.  Households over the age of 65 in 2011 accounted for 22.1 percent of all households, but just 14.4 percent of occupants of units built since 2000 (Figure 4).  Among all owner heads of households, 26.9 percent were over the age of 65, but just 14.7 percent were heads in owner units built since 2000.  However, older households do account for a larger share of heads of households living in new rental units: 13.4 percent of renter heads are elderly, nearly equal to their 13.6 percent share of occupied rental units built since 2000.  This greater parity in representation of the elderly in newer rental units is consistent with the higher mobility rates of older renters compared to older owners.
                                                          
Source: Joint Center tabulations of 2011 American Housing Survey.

As the large baby boom cohorts age into the 65+ age groups, will they increase the share of elderly who live in newer housing?  An increase proportional to their growing share of the adult population (adjusted for their lower mobility rates) is certainly expected.  For example, according to recent Joint Center household projections, the elderly accounted for 23.3 percent of all households in 2014, increasing to 26.4 percent in 2020 and to 31.5 percent in 2030 when all baby boomers are over the age of 65.  If the elderly maintain their share of households living in newer units at current levels, about 20 percent of newly built units in 2030 will be occupied by heads over the age of 65.  But to increase the share of newly built housing occupied by the elderly significantly above that figure, tomorrow’s elderly will need to relocate out of older housing at higher rates than we now observe. 

For the next 15+ years, helping the elderly achieve a better fit with their housing will largely involve initiatives to support aging in place. The need for assisted living facilities and nursing homes will gradually increase as the baby boom ages, but the greatest increases will take place after 2030. Whether the elderly are likely to increase their mobility rates within market housing in the near-term future is worth considering.  Public and private efforts to provide housing that better serves the needs of an aging population could spur greater mobility among those ages 65+.  However, there are a host of demographic, social and economic characteristics of baby boomers that argue for less, not more, geographic mobility among the next generation of elderly. This topic will be the subject of a future blog post.   

Tuesday, March 12, 2013

Nonprofits Play Key Role in Repairing U.S. Homes

by Abbe Will
Research Analyst
Private sector spending on improvements and repairs to U.S. homes is approximately $300 billion a year. Yet as a new Joint Center working paper shows, each year nonprofit organizations and public agencies are also investing resources into the rehabilitation and repair of the homes of America’s most vulnerable households—including the elderly, disabled, and those with low-incomes—who might not otherwise be physically or financially able to undertake critical home remodeling and repair projects themselves. Major nonprofits such as Rebuilding Together, Habitat for Humanity, Enterprise Community Partners, the Local Initiatives Support Corporation, and NeighborWorks America, as well as thousands of local community development organizations across the country, are filling a significant and growing need, largely unmet by the private sector, by investing considerable resources—financial, technical, and direct provision of services—to make homes safer, healthier, more energy efficient, and more accessible for disadvantaged households.

The recent foreclosure crisis and sluggish economy undermined years of efforts to stabilize and improve distressed neighborhoods in cities across the country, only adding to the need for nonprofit and public sector involvement. Until this past cycle, housing inadequacy—a measure of the physical condition of housing units—had been on the decline in the United States, largely due to the success of govern­ment housing policies and the growing affluence of the pop­ulation. Since the housing market bust, however, this trend has reversed with the number of moderately or severely inadequate homes increasing by 7% between 2007 and 2011 to 2.4 million units. Certainly the severe housing and economic downturn had a measurable impact on the quality of the nation’s housing.

While a comprehensive data source of home rehabilitation and repair activity by nonprofits and public agencies does not exist, this new Joint Center working paper provides some insight into the topic. Rebuilding Together, one of the nonprofits in the study, provides critical home rehabilitation and modification services to low-income homeowners through its extensive network of local affiliates. A member of the Joint Center’s Remodeling Futures Steering Committee, the organization provided support for an affiliate and homeowner survey that collected data on the various types of projects undertaken by their affiliates, as well as demographic and socioeconomic information about the homeowners served and their experience partnering with Rebuilding Together.

Recent spending on home repairs and replacements, as reported by participating households, suggests that many of the homes worked on by Rebuilding Together have seen significant under-investment over the years. While the average American homeowner spent $3,000 on home improvements and repairs in 2011, according to Joint Center analysis of the American Housing Survey, almost two-thirds of Rebuilding Together program participants reported having spent less than $500 on average in the past year—fully 80% less than the typical homeowner in the U.S. Indeed, according to estimates developed by Rebuilding Together affiliates and the Joint Center’s Remodeling Futures Program, the homes serviced by Rebuilding Together were so in need after years of deferred maintenance, that the average value of the rehabilitation and repair projects undertaken by Rebuilding Together was in excess of $6,000 per home, or twice the annual amount spent by the typical homeowner in the U.S.

Home improvement expenditures under the Rebuilding Together program in 2011 were heavily oriented toward exterior replacements and kitchen and bath improvements—projects that would produce the greatest gains in key program objectives such as health and safety concerns, accessibility, and savings in energy use. Typical projects included additions or replacements of steps, ramps, railings, grab bars, windows and doors, roofing, insulation, energy-saving appliances, as well as painting and plumbing and electrical repairs. In the end, Rebuilding Together participants reported significant improvements in health and safety concerns, improvements in accessibility, and energy use savings as a result of nonprofit involvement.


Source: 2011 Harvard JCHS-Rebuilding Together Household Survey

While a more precise estimate is unavailable, hundreds of millions of dollars are spent each year by nonprofits such as Rebuilding Together, community organizations, and public agencies. Their contributions not only improve conditions for residents, they also help preserve badly-needed affordable housing opportunities, stabilize and revitalize deteriorating neighborhoods—of special importance in recent years—and encourage neighborhood stability by helping long-term residents of the community to remain safely in their homes.

Thursday, March 7, 2013

A Surge in Hispanic Household Growth? The Challenge of Interpreting Short-Term Trends in Datasets that are Occasionally Adjusted

by Dan McCue
Research Manager
Interpreting year-to-year changes in annual surveys from the Census Bureau can be a tricky business, especially around decennial censuses.  Because it is the largest and most comprehensive count of the population, after each new decennial census is released, the smaller but more frequently issued surveys available from the Census Bureau, such as the Current Population Survey (CPS), Housing Vacancy Survey (HVS) and American Housing Survey (AHS), are updated, or “re-benchmarked” based on the findings from the new decennial census.  Prior to this, these surveys were controlled to extrapolations based off of the prior decennial census. While it is inevitable that ten years of extrapolation can lead controls to drift off course, failing to recognize when and how datasets are re-benchmarked to correct for this drift can lead to misinterpretations about short-term trends.  The danger is that the re-benchmarking adjustment can be misinterpreted as an actual trend that occurred in a single month or year, rather than what it really is: a discontinuity in the data due to an adjustment made to correct the net sum of ten years of extrapolation errors that had accumulated in the dataset since the last decennial census.

Take for instance, the following data overview in a recent online article:

"The latest U.S. census figures, for June, show year-over-year Hispanic homeownership increased by 7.3 percent, from 6.2 million to 6.7 million. For black-owned households during the same time, the numbers dipped by 1.3 percent, from 6.3 million to 6.2 million. Likewise, whites' homeownership also saw a slight decrease of about 1 percent, from 58.4 million to 57.8 million." - National Journal

On its face, this data leads us to conclude that the number of Hispanic homeowners surged from June 2011 to June 2012, while at the same time the number of homeowners among both blacks and whites dropped significantly, and therefore without growth in Hispanic homeownership the overall number of homeowners in the US would have dropped significantly over the past 12 months instead of growing slightly as was reported.

However, the Census Bureau’s Housing Vacancy Survey (HVS) showed that both Hispanic and non-Hispanic homeownership rates dropped during the June 2011 to June 2012 period, a time wherein Hispanics also suffered higher than average unemployment rates. At first glance, the divergence in the two reports is puzzling. However, on the Census Bureau’s HVS website, there is a short but significant sentence under the “Changes in 2012” section of the Source and Accuracy of Estimates web page:   

“Beginning in the first quarter 2012, the population controls reflect the results of the 2010 decennial census.”  - HVS Source and Accuracy of Estimates

This note is important, because the distribution of occupied households by tenure, race, and ethnicity of households is based on these population controls.  Therefore, any changes in the number of homeowners by race and ethnicity that spans across the first quarter of 2012 is also incorporating change due to the shift in the distribution of households by age, race, and tenure that occurred with the re-benchmarking of the survey..

The adjustment to Hispanic households due to the re-benchmarking appears to be significant. Looking at the Hispanic share of households in HVS before and after Q1 of 2012, we can see that the re-benchmarking in that quarter led to a significant upwards adjustment that forms a discontinuity in this series (Figure 1).  The existence of a discontinuity is corroborated by data from the Current Population Survey, which re-benchmarked to the 2010 Census in 2011. The CPS Table Creator allows us to see the impact of the re-benchmarking directly by comparing the Hispanic share of households in 2011 under both 2000 and 2010 Census weights.  It shows that the 2010 census weights raise the Hispanic share of households a full percentage point, from 11 to 12 percent, compared to the 2000 census weights.  In short, this all suggests that results from the 2010 Census found that the 2000 Census-based population extrapolations had been underestimating Hispanic household growth in the 2000s, and therefore these household counts needed to be shifted upwards in 2012 as a correction.

Figure 1:  The Shift to 2010-Based Population Controls in Q1 of 2012 in the HVS Coincides with an Apparent Discontinuity in the Hispanic Share of Householders


Source: JCHS tabulations of US Census Bureau, Housing Vacancy Survey data.

With the change in population controls in the HVS in Q1 of 2012, the amount to which the shift in the distribution of households towards Hispanic households was underestimated incrementally over the last ten years gets corrected all at once, and gets attributed as change measured between Q4 of 2011 and Q1 of 2012.  And as we see in Figure 2, the quarterly change recorded in Q1 of 2012 has a huge influence over our view of the recent trend in household and homeownership growth by Hispanic ethnicity. 

Figure 2: Concurrent with the Switch to Census 2010-Based Population Controls, The First Quarter of 2012  Has a Large Influence on the Recent Trend in Hispanic and Non-Hispanic Household Growth 

Source: JCHS Tabulations of the 1995-2011 AHS

Without the ability to compare alternative HVS household counts for Q1 of 2012 under both 2000- and 2010-based population controls, it is difficult to determine exactly how much of the change in Hispanic and non-Hispanic households and homeowners in 2011 to 2012 was due to the re-benchmarking and how much was due to actual change measurable in the survey.  We refrain from presenting alternative scenarios here, but because the quarter is such an outlier, most assumptions to smooth or discount that quarter of data would conclude with much lower Hispanic household and homeowner growth and much higher growth among non-Hispanics over the past year.  

Wednesday, February 27, 2013

The Return of Substandard Housing

by Kermit Baker
Director, Remodeling
Futures Program
The magnitude of the housing bust that began in the middle of the past decade is well documented, with a 75 percent plunge in housing starts, 45 percent decline in existing home sales, and 30–35 percent slide in house prices. Less well known is how the housing bust and the ensuing cutbacks in residential investment have eroded the condition of existing homes.

Reasons for concern over the potential for underinvestment in the housing stock are numerous, from the aging of the rental stock to the rising share of homeowners with underwater mortgages to the surge in foreclosures and short sales. In fact, there has been a significant decline in spending on homes during the housing bust. Average annual improvement spending by owners declined 28 percent between 2007 and 2011 after adjusting for inflation, totally erasing the run-up in spending during the boom years. Rental units never saw a run-up last decade, so per unit spending was down 23 percent between 2001 and 2011.

Figure 1

Sources: JCHS tabulations  of 2001-07 C-50; 2001-11 AHS; and Estimating National Levels of Home Improvement and Repair Spending by Rental Property Owners by Abbe Will, JCHS Research Note N10-2, October 2010.

There has been surprisingly little concern in policy circles that this significant reduction in housing investment might be producing deterioration in our housing stock. Thanks largely to the success of government housing programs and the increasing affluence of our population, the condition of the housing stock has largely dropped from policy makers’ radar screens in recent decades.

The first Census of housing in 1940 labeled 45.4 percent of owner-occupied units as substandard, which was defined as housing which lacked complete plumbing facilities or was dilapidated. This share dropped sharply over the next several decades, falling all the way to 6.1 percent in 1970 according to Clemmer and Simonson’s analysis in a 1983 article in the AREUEA Journal. Because measures of housing quality were dropped after the 1970 Census due to unreliability of data and the subjective measurement of structural quality, more recent statistics on the number of substandard units are not available from the Census.

However, beginning in the early 1970s, information from the American Housing Survey (AHS) points to the structural condition of the housing stock continuing to show slow but continuous improvement.  As of the 2007 AHS, just 2.27 million owner-occupied homes, or 3.0 percent of the total, were characterized as moderately (with fairly minor structural problems) or severely inadequate (with more major structural problems), down from 3.24 million or 5.1 percent of the total in 1995.

Figure 2


Notes: A housing unit is defined as inadequate through a combination of gross unit attributes such as lacking complete kitchen or bathroom facilities or running water, as well as signs of disrepair such as leaks, holes, cracks, peeling paint, and broken systems. For a complete definition, see the US Department of Housing and Urban Development’s Codebookfor the American Housing Survey, Public Use File: 1997 and Later.  Source: JCHS tabulations of the 1995-2011 AHS.

Since the housing market bust, however, this trend has reversed. By 2011, more than 2.4 million owner-occupied homes were classified as inadequate, an increase of 160,000 from the 2007 AHS. While this increase seems fairly minor in the big picture, the importance of it is not. Given available data, this appears to be the first significant increase in the share of homes with structural problems since the government was able to track them beginning with the 1940 census.

Now that the housing market is recovering and residential investment is increasing, this dip in the quality of the housing stock may well reverse as these homes are improved. However, recent Joint Center analysis concludes that once a downward cycle in housing quality is underway, for many homes it doesn’t get reversed. This analysis focused on owner-occupied homes that were characterized as inadequate in 1997, looking at their experience over the following decade but before the dramatic rise in distressed properties.

According to the 1997 AHS, 4.4 percent of owner-occupied homes were considered inadequate. By 2007, these units accounted for almost 8 percent of homes in this 1997 cohort that were no longer owner-occupied (vacant, or converted to rental or nonresidential uses), suggesting that they were less in demand. Even more telling is that these inadequate units accounted for almost 17 percent of all 1997 owner-occupied homes that were demolished within the decade.

The longer-term fate of the current slightly larger number of inadequate homes is unknown. Many of these homes likely will be renovated to provide affordable housing opportunities. However, many may not recover without extra help. Given the extraordinary circumstances that many homes have gone through in recent years, particularly foreclosed homes that often were vacant and undermaintained for extended periods of time as they worked their way through the foreclosure process, they may be more at risk than their inadequate predecessors. It’s probably time to put the structural condition of the housing stock back on the housing policy agenda.