Showing posts with label zip codes. Show all posts

Wednesday, May 23, 2018

How Do We Proactively Preserve Unsubsidized Affordable Housing?

by David Luberoff
Deputy Director
Robust land bank and land trust partnerships, long-term lease-purchase programs, and low-interest renovation loans with affordability requirements are three tools that policymakers and mission-driven organizations can use to get ahead of real estate price appreciation, according to Proactive Preservation of Unsubsidized Affordable Housing in Emerging Markets: Lessons from Atlanta, Cleveland, and Philadelphia, a new working paper jointed published by the Joint Center for Housing Studies and NeighborWorks® America. Written by Matt Schreiber, a Master of Urban Planning student at the Harvard Graduate School of Design who was a 2017 Edward M. Gramlich Fellow in Community and Economic Development, the paper draws on work done by public and non-profit entities in all three cities.

North Philadelphia (Credit: Tony Fischer/Flickr)

In those places, Schreiber notes, median house prices range from $60,000 to $250,000, which suggests that they have an ample supply of affordable units. However, housing in those markets actually remains out of reach for so many residents, whose incomes are not growing as rapidly as house prices, which, according to Zillow's Home Value Index, rose by 8-11 percent in 2017. Such increases, and the fact that prices rose in more than 90 percent of the zip codes in those three cities, led Schreiber to ask what policymakers and the leaders of mission-driven organizations could do to get ahead of real estate price appreciation and, in doing so, proactively preserve their city's stock of affordable housing.

Schreiber used a four-part methodology to answer this question. First, he identified emerging markets; those areas that have not yet experienced the price appreciation effects of gentrification, but are likely to do so in the near future because they are close to each city's central business district, anchor institutions, or its other already-gentrified areas. Second, he reviewed the housing stock in these "likely-to-gentrify" areas, which made it clear that most of the affordable housing in these places are unsubsidized units located in one-to-four unit buildings. Third, he interviewed local stakeholders and national experts to learn their views on promising ways to find the balance between improving the quality of the housing stock while preserving its long-term affordability for low-income residents.

Those interview informed the fourth and final step: identifying and assessing three strategies that may address this challenge: building stronger partnerships between local land banks and local land trusts, creating lease-purchase programs that make homeownership more accessible for people of modest means, and offering low-interest loans that help owners renovate unsubsidized affordable units in return for long-term commitments to keep those units affordable for many years to come. Taken together, he notes, these strategies can help maximize the efficiency of the limited resources available to preserve and develop affordable housing. Moreover, the experiences in the three cities suggest "it is possible for mission-driven organizations and policymakers to get ahead of gentrification and proactively preserve vulnerable, unsubsidized affordable housing for low-income residents."

Thursday, February 22, 2018

Do State Income Taxes Affect Home Values?

by David Luberoff
Deputy Director
State and local governments account for about 40 percent of all tax collections in the United States, but federal taxes command most of the attention in academic literature. In a new Joint Center working paper, Nathaniel Hipsman, a doctoral student in economics at Harvard who also is a Joint Center Meyer Doctoral Fellow, tries to fill this gap by investigating the effect of state income taxes on home prices.

To do so, he uses Zillow data on housing costs in over 11,000 ZIP Codes going back to the mid-1990s. While these data don't cover the entire country, they do cover more than half of the nation's residents. Hipsman focuses most closely on house prices in the more than 500 ZIP Codes that cover areas on the borders between two states. Using the TAXSIM model developed at NBER, Hipsman considers, for each tax year, the total income tax bill (federal plus state) that the same household would face were they to live in another state. Analyzing relative changes in these tax bills over time allows him to estimate whether and how changes in state tax burdens affected home values.


At first glance, the data seem to indicate that notable changes in state tax rates (or differences in bordering states' tax rates) could have dramatic impacts on home values. One of Hipsman's models, for example, indicates that a one percent drop in taxes might cause as much as a five percent increase in home values. However, Hipsman cautions against making too much of that finding. "Ultimately," he writes, "the evidence is inconclusive; standard errors are large, and different specifications lead to different conclusions."

This inconclusiveness, he adds, shows that while border-pair studies, such as his analyses, can offer important insights about policies governing taxes and spending, the results of those findings should be carefully tested before they are used for policymaking. "Obtaining a good estimate" of how changes in taxes affect home values, he concludes, "is important of further study."

Thursday, October 6, 2016

Housing Recovery by Income in Two Metros: San Francisco and St. Louis

by Alex Hermann
Research Assistant
The increases in home prices that have occurred since the Great Recession not only vary across the nation’s metropolitan areas, they also vary within many metros as well. The San Francisco metropolitan area, where home values are now 16 percent above their pre-recession peak, and the St. Louis metropolitan area, where home values are still 10 percent below their pre-recession peak, illustrate these variations.

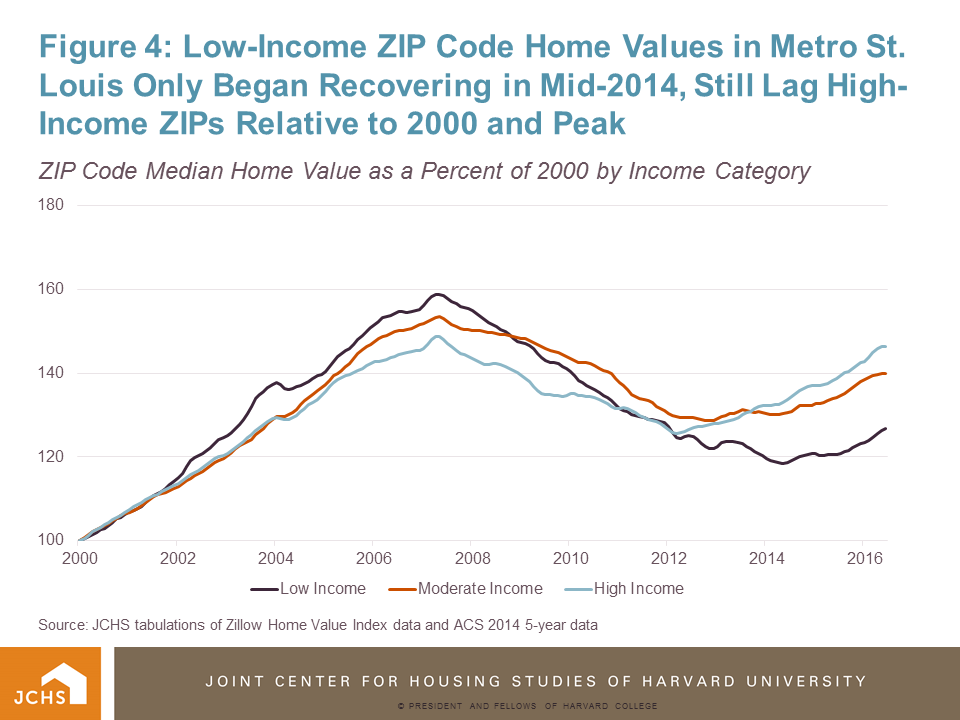
In both areas, median home prices in low-income ZIP Codes are less likely to exceed mid-2000 peaks than median prices in high- and moderate-income ZIPs. However, the regions vary when looking at the changes in house prices between 2000 and 2016. Over that time period, the percentage increase in median prices in the Bay Area’s low-income ZIPs was greater than the increases in high- and moderate-income ones. In contrast, the percentage increase in St. Louis’ low-income ZIP Codes was much smaller than the increase in that region’s high- and moderate-income ZIP Codes. (In this analysis, low-, moderate-, and high-income ZIP Codes have a median household income under 80 percent, between 80 and 120 percent, and above 120 percent of their state’s median income, respectively.)

Changes in home price also vary within both metros. For example, metropolitan San Francisco has had the eighth strongest post-recession recovery in home prices. As a result, median home values in San Francisco’s high-income ZIP Codes are about $1.18 million dollars while the median value in low-income ones are $586,000, more than three times the median price for the U.S. as a whole, which is $186,500.

However, home values in many of the region’s ZIP Codes are still below their pre-recession peak (Figure 1). In all, 31 of San Francisco’s 142 ZIPs, or 22 percent, have yet to regain their mid-2000 peaks, including:

  • 50 percent (5 of 10) of low-income ZIPs
  • 35 percent (12 of 34) of moderate-income ZIPs, and
  • 14 percent (14 of 98) of high-income ZIPs.

 Click to enlarge
Source: JCHS tabulations of Zillow Home Value Index data and ACS 2014 5-year data

Most ZIP Codes that have not regained their peak median home values are located on the outskirts of Metro San Francisco, particularly in northern Contra Costa County. That area is home to 10 of the 14 high-income ZIP Codes where median prices have not exceeded their pre-recession peak as well as 8 of the 12 moderate-income ones and three of the five low-income ones. Most of the remaining ZIP Codes where prices are still below pre-recession peaks are in the urban areas south of Oakland along the East Bay, which includes many low and moderate-income ZIP Codes as well as two high-income ones.

Although prices in San Francisco’s low-income ZIP Codes are less likely to regain their pre-recession peaks, the trend is different when examining price changes since 2000. Overall, home values increased in all the region’s ZIP Codes. But on a percentage basis, the values in low-income ZIP Codes increased more rapidly than those in high-income areas (Figure 2).

 Click to enlarge
JCHS tabulations of Zillow Home Value Index data and ACS 2014 5-year data

The story is somewhat different in metropolitan areas that have not seen San Francisco’s rapid price appreciation, such as St. Louis, where home values in June 2016 were still 10 percent below their pre-recession peak. There, median prices exceeded their peaks in only 27 of 147 ZIP Codes, most of them located in the region’s urban core and suburban Madison County. (Figure 3). These unrecovered areas include:

  • 1 of 35 (3 percent) low-income ZIPs
  • 6 of 55 (11 percent) moderate-income ZIPs, and
  • 20 of 57 (35 percent) high-income ZIPs.

 Click to enlarge
JCHS tabulations of Zillow Home Value Index data and ACS 2014 5-year data

Moreover, unlike San Francisco, prices in low-income ZIP Codes in St. Louis have grown only modestly since 2000 and have increased much less than those in high- and moderate-income ZIP Codes. In the run-up to peak, prices in low-income ZIP Codes grew only marginally faster than prices in high-income ZIPs. Additionally, the post-recession upturn in home values in low-income ZIPs lagged the increase in high-income ZIP Codes by nearly two years (Figure 4).

 Click to enlarge
JCHS tabulations of Zillow Home Value Index data and ACS 2014 5-year data

What to take away from this analysis? Overall, home values in high-income ZIP Codes have outpaced home-value gains in low-income ZIPs since the price peak of the mid-2000s. When taking a broader view, low-income ZIP Codes have performed as well as high-income ZIPs since 2000 in fast-appreciating markets like San Francisco, while in many lagging markets, like St. Louis, home value gains in high-income ZIPs have typically surpassed those in low-income ZIPs. Furthermore, though income levels are important they are not determinative. The geographic patterns also underscore the fact that trends in home values are also a function of features such as density and proximity to the central city.

These relationships, and others, will be discussed in a forthcoming Joint Center working paper on home value trends since 2000.

Tuesday, September 27, 2016

High-Income ZIP Codes Benefit Most from Housing Recovery

by Alexander Hermann
Research Assistant
Although home prices nationally have been on the upswing since early 2012, the increases have not only been uneven across metropolitan areas but are more likely to have occurred in the most affluent parts of each metropolitan area, according to a new Joint Center analysis of Zillow home value data.

Most notably, home values in high-income ZIP Codes that are home to their region’s more affluent residents are now about 1 percent higher than their post-2005 peak, while values in low-income ZIP Codes—which increased dramatically in the early 2000s—are still about 12 percent below their pre-recession peak. Moreover, home values in moderate-income ZIP Codes are still about six percent below their pre-recession peak (Figure 1). (In this analysis, low, moderate, and high-income ZIP Codes have a median household income less than 80 percent, between 80 and 120 percent, and above 120 percent of the state median income, respectively.)

Source: JCHS tabulations of Zillow Home Value Index data and ACS 2014 5-year data.

Moreover, home prices in low-income ZIP Codes are lagging both in recovered metropolitan areas as well as in metros yet to regain their peak price. Specifically, in recovered metros, 83 percent of high-income and only 65 percent of low-income ZIP Codes had median home values matching or exceeding their peak, a full 18-point difference. In metro areas within 15 percent of peak, but still below, 22 percent of high-income ZIP Codes have recovered relative to 9 percent of low-income ZIP Codes. In metropolitan areas furthest from peak—by one measure, those that remain hardest hit—only a sliver of low-income ZIPs (5 of 699) have recovered, compared with 37 of 899 high-income ZIP Codes (4 percent). In total, across the nation, 37 percent of high-income ZIP Codes have recovered, versus only 23 percent of low-income ZIP Codes (Figure 2).

Source: JCHS tabulations of Zillow Home Value Index data and ACS 2014 5-year data.

Extending the analysis to 2000 demonstrates why high-income ZIP Codes have been more likely to recover. Low-income ZIP Code home values increased tremendously during the housing boom, but a similarly harsh decline has made recovery more difficult, and has significantly weakened low-income ZIP Code home value gains since 2000 relative to high-income ZIPs. At peak, the median home value in low-income ZIP Codes more than doubled (increasing 101 percent) from January 2000 (Figure 3). The peak median value in high-income ZIP Codes increased only 82 percent. However, the post-recession decline wiped out a large share of the relative gains low-income ZIP Codes had made. In these ZIPs, median home values (as a percent of the January 2000 home value) dropped nearly 65 percent. In high-income ZIP Codes, the drop was 38 points. This precipitous decline, and a lagging recovery, have given high-income ZIPs a narrow edge in median home value increases overall. As of June 2016, median home values in high and low-income ZIPs were 84 and 76 percent, respectively, above their 2000 median home value.

Source: JCHS tabulations of Zillow Home Value Index data and ACS 2014 5-year data.

The overall trend varies somewhat when breaking ZIP Codes down into recovered and unrecovered metros. In recovered metros, median home value gains in high-income ZIP Codes have steadily outpaced those in low-income metros over time, sharply accelerating during the recovery (Figure 4). In unrecovered metros (which include nearly 70 percent of ZIP Codes in our sample), home values in low and high-income ZIP Codes have drawn about even in the long run (Figure 5). Figure 5 also shows that the metros worse off relative to past peaks are those where low-income ZIPs saw substantial home value gains relative to their initial home value and large declines during the recession. In these unrecovered metros, ZIP Codes in both categories have median home values about 79 percent above their 2000 values.

Source: JCHS tabulations of Zillow Home Value Index data and ACS 2014 5-year data.

Note: Percentage growth derived from nominal dollars.
Source: JCHS tabulations of Zillow Home Value Index data and ACS 2014 5-year data.

In an upcoming post, we’ll take a closer look one US metro that illustrates the uneven price recovery within its own ZIP Codes – San Francisco.