Showing posts with label affordability. Show all posts

Friday, June 1, 2018

Winner of 2018 Best Paper on Housing Prize Focuses on Philadelphia's Efforts to Address Climate Change and Affordable Housing

by David Luberoff,
Deputy Director
The Philadelphia Energy Campaign (PEC) is an unlikely success story of a municipal climate initiative prioritizing the needs of its marginalized residents by preserving affordable housing through energy policy, according to Caroline Lauer, a recent graduate of the Harvard Graduate School of Design, whose thesis on PEC received the 2018 Joint Center for Housing Studies Best Paper on Housing Prize.

In "A Pathway to Preservation? Planning Processes at The Intersection of Climate Change and Affordable Housing in Philadelphia, Pennsylvania", Lauer, who received a Master of Urban Planning, provides a detailed case study on PEC's history and goals, and links that history to literature on both planning and public policymaking.

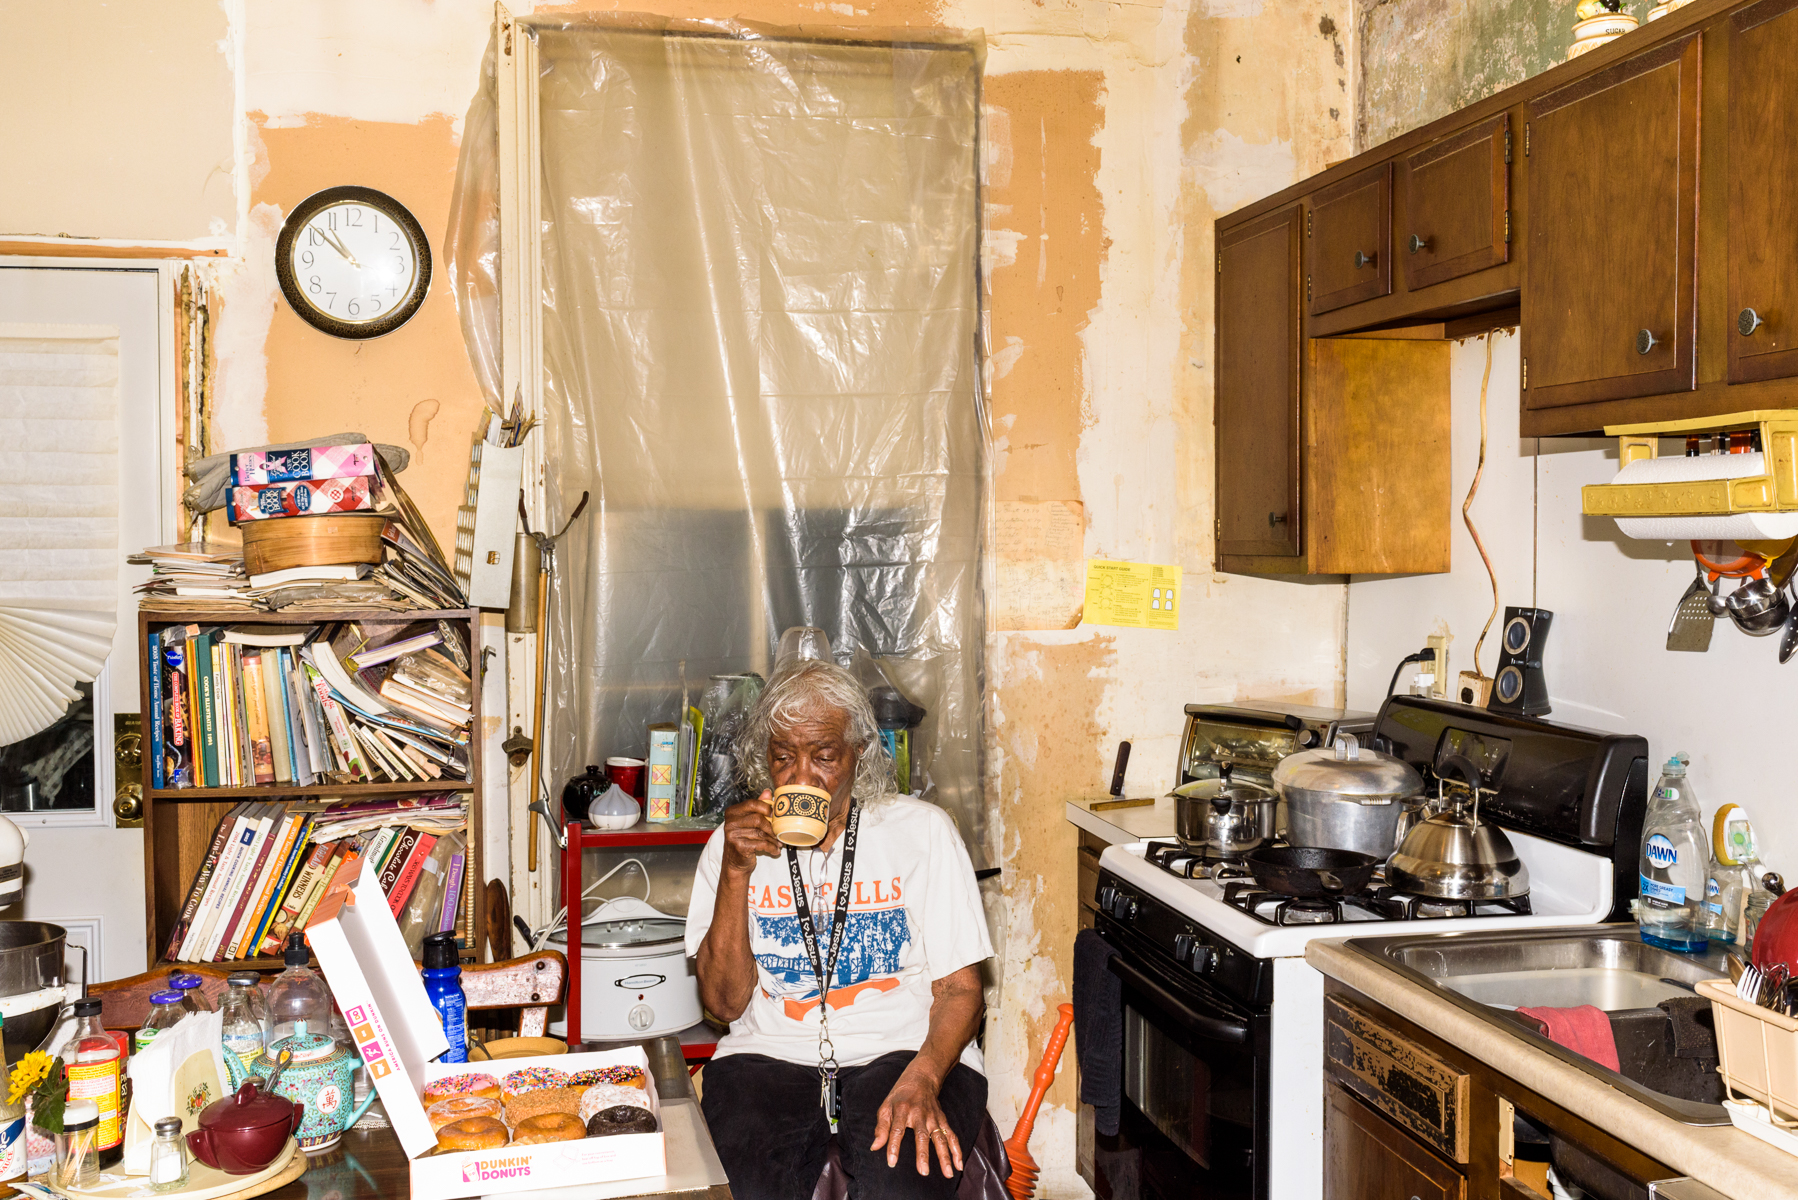
Credit: Philadelphia Energy Authority/Jordan Baumgarten

PEC has an ambitious set of goals, writes Lauer. It aims to create jobs, strengthen communities, cut energy bills, and reduce Philadelphia's carbon footprint by leveraging $1 billion of public and private investment over ten years. This effort, she explains, is especially notable because, while cities across the United States have been actively planning for climate change for at least two decades, equity considerations, such as the impact of climate investments on disadvantaged communities, have often been overlooked or ignored when those plans have been prepared and implemented.

According to Lauer, the Philadelphia Energy Authority, which was created in 2010, became a notable exception largely because of the values and skills of Emily Schapira, who launched the PEC campaign not long after she became the authority's executive director in 2016. Lauer observes that, while the typical focal point of an energy initiative is the fastest or most efficient way to reduce energy consumption, the focus of the PEC has been the residents who will benefit the most from the energy reduction today. She adds that by "inextricably linking equity and energy, the PEC prioritizes the needs and interests of the many low-income and minority residents" in Philadelphia, which not only has the highest poverty rate of the ten largest American cities but has relatively old, poorly-maintained, energy-inefficient housing stock. Moreover, she notes that Philadelphia, a Democratic stronghold, has had to do much of this work without significant support from the state legislature, which was overwhelmingly Republican when the campaign got underway.

Succeeding in this complex milieu, she notes, has required skilled and committed leadership that not only is attuned to equity and energy issues but also is cognizant of, and responsive to, political considerations. Combining these approaches can be difficult, writes Lauer, who observes that "community development efforts to preserve affordable housing through energy efficiency are rare." However, she adds, "PEC demonstrates that merging both objectives into one program is a viable policy option."

Wednesday, May 23, 2018

How Do We Proactively Preserve Unsubsidized Affordable Housing?

by David Luberoff
Deputy Director
Robust land bank and land trust partnerships, long-term lease-purchase programs, and low-interest renovation loans with affordability requirements are three tools that policymakers and mission-driven organizations can use to get ahead of real estate price appreciation, according to Proactive Preservation of Unsubsidized Affordable Housing in Emerging Markets: Lessons from Atlanta, Cleveland, and Philadelphia, a new working paper jointed published by the Joint Center for Housing Studies and NeighborWorks® America. Written by Matt Schreiber, a Master of Urban Planning student at the Harvard Graduate School of Design who was a 2017 Edward M. Gramlich Fellow in Community and Economic Development, the paper draws on work done by public and non-profit entities in all three cities.

North Philadelphia (Credit: Tony Fischer/Flickr)

In those places, Schreiber notes, median house prices range from $60,000 to $250,000, which suggests that they have an ample supply of affordable units. However, housing in those markets actually remains out of reach for so many residents, whose incomes are not growing as rapidly as house prices, which, according to Zillow's Home Value Index, rose by 8-11 percent in 2017. Such increases, and the fact that prices rose in more than 90 percent of the zip codes in those three cities, led Schreiber to ask what policymakers and the leaders of mission-driven organizations could do to get ahead of real estate price appreciation and, in doing so, proactively preserve their city's stock of affordable housing.

Schreiber used a four-part methodology to answer this question. First, he identified emerging markets; those areas that have not yet experienced the price appreciation effects of gentrification, but are likely to do so in the near future because they are close to each city's central business district, anchor institutions, or its other already-gentrified areas. Second, he reviewed the housing stock in these "likely-to-gentrify" areas, which made it clear that most of the affordable housing in these places are unsubsidized units located in one-to-four unit buildings. Third, he interviewed local stakeholders and national experts to learn their views on promising ways to find the balance between improving the quality of the housing stock while preserving its long-term affordability for low-income residents.

Those interview informed the fourth and final step: identifying and assessing three strategies that may address this challenge: building stronger partnerships between local land banks and local land trusts, creating lease-purchase programs that make homeownership more accessible for people of modest means, and offering low-interest loans that help owners renovate unsubsidized affordable units in return for long-term commitments to keep those units affordable for many years to come. Taken together, he notes, these strategies can help maximize the efficiency of the limited resources available to preserve and develop affordable housing. Moreover, the experiences in the three cities suggest "it is possible for mission-driven organizations and policymakers to get ahead of gentrification and proactively preserve vulnerable, unsubsidized affordable housing for low-income residents."

Monday, May 7, 2018

Leveraging Resiliency to Promote Equity

by David Luberoff
Deputy Director
Faced with the increased threat of natural disasters, some community-based organizations are trying to link their efforts to better plan for catastrophic events with their existing efforts to address issues like affordable housing and economic development, according to "Bounce Forward, Not Back: Leveraging Resiliency to Promote Equity," a new working paper jointly published by the Joint Center for Housing Studies and NeighborWorks® America. Written by Caroline Lauer, a master in urban planning student at Harvard's Graduate School of Design who was a 2017 Edward M. Gramlich Fellow in Community and Economic Development, the paper draws lessons from the growing literature on resiliency and from two case studies of notable initiatives carried out by organizations in NeighborWorks' national network of independent, nonprofit organizations focused on affordable housing and community development.

A sample RAPIDO home.

The first case study describes work done by the Community Development Corporation Brownsville, which has worked with several other community groups to develop RAPIDO, a holistic approach to disaster recovery that, "aims to quickly and affordably rehouse individuals and families, building social capital within the community, and stimulating the local economy." The key to this effort, Lauer explains, is providing families with, "a simple 480-square-foot [structure] that contains essential facilities," and training a group of "Navigators" who can lead residents through the disaster recovery process. The units, which cost about as much as the temporary manufactured units typically provided to people who have lost their home to natural disaster, "can be built easily at local lumberyards, transported by basic trailers, and assembled on-site in three days by four people." Moreover, unlike the temporary housing, the units are permanent and can later be expanded.

The second case study focuses on NeighborWorks® Umpqua's Southwestern Oregon Food System Collaborative (SWOFSC) Seafood Project, a multi-faceted effort to address the struggles of the region's small-scale fisheries. This effort does so by investing in and fostering local processing facilities and other infrastructure to support local fishermen. At the same time, it also uses marketing and other strategies to increase the local and regional demand for less traditional types of seafood that, because of warming oceans, comprise increasingly large shares of what local fishermen are bringing into port. Moreover, the project leveraged these economic development initiatives to help the region prepare for both slow-moving disasters, such as the effect of climate change on the fish population, and for acute disasters, such as a storms, tsunami, or earthquakes that might reduce or even cut off the region's access to the mainland for an extended period of time.

Although the initiatives are quite different, and while it is too soon to fully gauge their effectiveness, Lauer contends that together they offer three important and timely lessons given the hurricanes that hit Texas and Puerto Rico and the wildfires that devastated parts of California and other western states last year (after she had carried out her research). First, their differing trajectories show that while efforts to link community and economic development initiatives with projects that are focused on resiliency and disaster response can have different starting points and program structures, they can still achieve similar goals. Second, both show that regardless of how they start and are structured, such efforts should focus on creating social and physical connections and structures that can be used to address a variety of pre- and post-disaster conditions, including structural inequality. Finally, she notes, such efforts strengthen a community's ability to respond not only to anticipated problems but to unforeseen challenges and potential disasters.

Thursday, March 22, 2018

How Do Funding and Review Processes Shape the Design of Affordable Housing?

by David Luberoff
Deputy Director
How do the notoriously complicated funding and approval processes for affordable housing shape the design of those projects? In particular, are these elements so complex that they make it difficult, if not impossible, to incorporate high-quality design into the planning and execution of affordable housing?

In a new paper, jointly published by the Joint Center and Enterprise Community Partners, Inc., and being presented at a Research Seminar tomorrow (Friday, March 23), Donald Taylor-Patterson, a second year Master of Urban Planning student at the Harvard Graduate School of Design and former Joint Center student research assistant, and I examine these questions as they pertain to Massachusetts in general, and to greater Boston in particular.

One Beach apartments, Revere, MA. Photo by Flagship Photos.

To do so, we drew on three sources of information. First, we carefully reviewed the state's Qualified Allocation Plan, which are the guidelines the state uses to allocate its annual allotment of federal Low-Income Housing Tax Credits (LIHTC), a key funding source for affordable housing. Second, Taylor-Patterson interviewed 18 leading experts in the field and we reviewed the insights that came from those discussions. Finally, Taylor-Patterson spoke with participants at Enterprise's 2017 Affordable Housing Design Leadership Institute (AHDLI), an annual event that brings together non-profit developers and design professionals to discuss how to improve the design of proposed affordable housing projects. (The research, it bears mention, did not attempt to define "design excellence," which can be subjective. Instead, the research focused on whether and how key actors and processes assessed the design quality of affordable housing developments.)

Four key findings emerged from this research. First, the LIHTC process in Massachusetts generally encourages design excellence for "invisible" project elements, particularly those that can be measured such as energy efficiency or accessibility. Second, the harder-to-measure "visible" or "aesthetic" design elements are often the product of the informal and formal ways that community groups and local governments review proposed affordable housing developments.

Third, while funding and approval processes sometimes crowd out efforts to improve design, key actors can bring design back into the picture, particularly if they can create (or take advantage of) well-timed processes that bring together developers, designers, and others for design-focused discussions that take funding and other constraints into account. Finally, although there is widespread agreement on some aspect of design excellence, the fact that each project's physical, political, and financial context is unique makes it almost impossible to use as regulatory process to specify what design excellence entails.

Taken together, these findings underscore how the complex interplay of funding, design, regulatory processes, and local politics creates both challenges and opportunities to ensure that affordable housing projects are designed and built in ways most likely to benefit both residents and neighborhoods. They also suggest that realizing design excellence for affordable housing projects is difficult but achievable. This is particularly true if the work plan for project development encourages and incentivizes processes that allow project designs to be challenged and pushed to a higher standard.

Monday, January 22, 2018

Really?! Ten Surprising Findings from the America's Rental Housing Report

by Jonathan Spader
Senior Research Associate
Following the release of our America's Rental Housing report last month, one of the most common questions has been: "Which findings are new or surprising to you?" This is never an easy question to answer, and different readers are likely to find different aspects of the report surprising.

Nevertheless, the list below contains the 10 findings that were, in some way, new or surprising to me. Some reflect new trends, some are the result of new analyses and/or data sources, and some are longstanding findings that I continue to find astonishing.

1. The rental stock grew, and all growth has been among units renting for over $850/month. 

While the total number of rental units in the US increased by 7.2 million between 2006 and 2016, in constant dollars, there was nearly no increase in the number of units renting for less than $850 per month, and the number of units renting for less than $650 fell by 475,000 units. In contrast, units renting for $850 or more accounted for the entirety of the growth, with 53 percent coming from units renting for over $1,500 per month. As our interactive tool shows, the lack of growth in low-cost units occurred in a wide variety of metro areas.

2. New rental starts slowed in 2017. 

Construction starts of new multifamily units are down 9 percent year-over-year through October 2017 on a seasonally-adjusted basis. The slowdown was first evident in 2016 when permitting fell in nearly half of the nation’s 50 largest markets. While this slowdown suggests that the recent rental construction boom is softening, new rental starts nonetheless remain at a healthy level.


3. The rental market is softening, particularly for high-cost units. 

After declining for years, the national vacancy rate rose from 6.9 percent in the third quarter of 2016 to 7.2 percent in the third quarter of 2017. The softening is concentrated among high-cost units. RealPage data shows that the vacancy rate for Class A properties increased by 1.5 percentage points year over year through the third quarter of 2017, whereas the vacancy rate for Class C units ticked up only slightly and remains near its post-recession low.

4. Conversions of single-family homes to rentals have slowed. 

The number of single-family rental homes increased by 4 million between 2001 and 2016, driven by conversions of formerly owner-occupied properties during the foreclosure crisis. However, this trend moderated in recent years. According to the American Community Survey, 2015 was the first year since 2006 when the number of single-family rentals declined. While growth turned positive again in 2016, it remained well below levels of the prior decade.

5. The number of renter households jumped by nearly a third between 2004 and 2016. 

The number of renter households increased from 33 million in 2004 to 43 million in 2016—an increase of 10 million renter households in just over a decade! This isn’t a new finding, per se, but it amazes me every time I see it. And several aspects of this growth are new…

6. Renter households with incomes over $100,000 account for 30 percent of growth over the past decade. 

While renters with incomes of $100,000 or more made up just 9 percent of all renters in 2006, they accounted for 30 percent of renter household growth through 2016. As another one of our interactive tools shows, this trend is particularly pronounced in high-cost metros. Renters with incomes over $100,000 accounted for 93 percent of renter household growth in San Francisco and 65 percent in New York City during this period.

7. Households over 50 accounted for more than half of renter household growth over the past decade. 

While renters age 50 and over made up 30 percent of all renter households in 2006, they accounted for 52 percent of renter household growth through 2016. In contrast, households under age 35 made up 42 percent of renter households in 2006 but accounted for just 24 percent of renter household growth through 2016.

8. Older renters are almost twice as likely to live in large multi-family buildings than in single-family homes. 

Among renter households age 75 and over, 48 percent lived in large multi-family properties (those with 20+ units) and just 26 percent lived in single-family homes. For comparison, across all rental units, just 21 percent of units are in large multi-family properties and 39 percent are single-family homes. Older adults’ preference for large multi-family buildings may in part reflect the improved accessibility features in these buildings such as no-step entry, single-floor living, and extra wide hallways and doors to accommodate a wheelchair.

9. Almost 40 percent of rural renters are cost burdened. 

In rural areas—defined as areas with less than 10,000 in population that are outside the Census-defined metropolitan and micropolitan areas—39.5 percent of all renter households are cost burdened, paying more than 30 percent of their income for housing costs. While this figure is below the 51 percent cost burden share observed in the nation’s nine largest metropolitan areas, it is striking because rural areas are likely to have the fewest obstacles to adding new units that would tend to keep housing costs down. As our online map shows, rural areas with relatively high cost burdens can be found throughout much of the country.

10. Low-income renters have seen their residual income decline by 18 percent since 2001. 

Renters with incomes in the bottom quartile of all U.S. incomes had, on average, just $600 left over per month in 2001 after paying for housing costs. By 2016, this figure fell to below $500, an 18 percent decline. In contrast, among renters with above-median incomes, income growth has outpaced the rising cost of rental housing, leaving them with more to spend after paying for housing than similar renters in 2001.

Wednesday, January 3, 2018

Low-Cost Rental Housing Increasingly Difficult to Find

by Elizabeth La Jeunesse
Research Analyst
While rental markets are cooling nationally, market conditions remain extremely tight at the low end of the market, offering little relief to affordability pressures faced by renters with the lowest incomes, according to our new report, America’s Rental Housing 2017.

In fact, by several metrics, lower-priced housing is increasingly hard to find not only in high-cost coastal areas but also in many inland areas where rents are generally lower. Illustratively, vacancy rates for less expensive units – those with rents below the median for their metropolitan area – were below those for more expensive units in 42 of the nation’s 50 largest metros, including all but one of the nation’s largest 15 metros. Moreover, in 14 of the 50 largest metros, vacancy rates for less expensive units were less than or equal to 5 percent last year, compared to 2006, when just three metros had such tight conditions. The tightest markets were in San Francisco, Los Angeles, Seattle, and Portland, where vacancy rates for less expensive units were under 3 percent (Figure).

Notes: Less (more) expensive units are defined as those below (above) the area median contract rent in the same calendar year. Source: JCHS tabulations of US Census Bureau, 2016 American Community Survey.

Such ultra-low vacancy rates are unusual, at least compared to a decade ago. In San Francisco and Denver, for example, vacancy rates for units renting for less than the area median were closer to 8.5 percent in 2006 (a similar period of relative market strength), but by 2016, they had fallen to 2.0 and 3.4 percent, respectively. Similarly, in Seattle and Portland, vacancy rates for less-than-median-rent units were 5.8 and 5.6 percent respectively in 2006. However, in 2016, the vacancy rate for these units had fallen to just 2.9 percent. In fact, the only major metro to see consistently low vacancy rates in the lower-cost segment during both periods was Los Angeles, where the rate declined from 3.4 percent in 2006 to 2.9 percent in 2016.

Metro areas with the steepest drops in the vacancy rate for less expensive units from 2006 to 2016 generally had high vacancy rates to begin with. For example, in Cincinnati and Kansas City lower-rent vacancy rates declined from 16.7 and 14.2 percent, respectively, in 2006 to 7.5 and 6.7 percent in 2016. The Nashville and Detroit rental markets were also transformed over this period, with vacancy rates for low-rent units dropping from 10.0 and 10.9 percent, respectively, to 4.7 and 6.1 percent.

Data from RealPage, Inc., which classifies professionally managed apartment markets into three segments (according to quality and cost for the area) confirm these trends. Within the 100 markets they track, vacancy rates in the highest-priced Class A segment rose 1.5 percentage points over the past year to 6.0 percent while those in the mid-priced Class B segment rose 1.0 percent to 4.6 percent. In contrast, vacancy rates in the low-cost Class C segment remained relatively unchanged from the past year at 4.1 percent in the third quarter of 2017—their lowest level since the early 2000s. Moreover, in a handful of markets, including Miami, San Jose, Honolulu, San Diego, Sacramento, Minneapolis, Portland, and Orlando, vacancy rates in the Class C segment were below 1.5 percent.

The bottom line is that while rental markets are cooling nationally, households in need of modestly-priced rental housing still face challenging conditions in many areas. Many previously low-demand markets heated up over the past decade, while markets for less-expensive units tightened further in metros that were already expensive. With vacancy rates for less expensive units at rock-bottom levels, relief from market cooling is unlikely to be felt soon by low-income families.

Full data for all metro areas, including median rents, is available in Table W-19 of the report’s appendix tables.

Thursday, December 14, 2017

New Report: Surge in the Supply of Higher-Cost Rental Housing is Slowing Amidst Persistent Affordability Challenges for Working-Class Households


A decade of unprecedented growth in the rental housing market may be coming to an end, according to our 2017 America’s Rental Housing report, being released today. Fewer new renter households are being formed, rental vacancy rates have risen, and rent increases have slowed. At the same time, renter demographics are changing and nearly 21 million households continue to pay more than 30 percent of their income for rent.

This year’s report paints a complicated picture of the rental market. We’re finally seeing the record growth in renters slow down, but while the market has responded to rental housing needs for higher-income households, there are alarming trends that suggest a growing inability to supply housing that is affordable for middle- and working-class renters, let alone those with very low incomes. Addressing these challenges will require bold leadership and hard choices from both the public and private sector.

The report is accompanied by a series of interactive tools and charts that explore rental housing trends at the state and metro level, including cost burdens, affordability, and changes in rental supply and demand. Highlights of the 2017 findings include:

  • SIGNS OF A SLOWDOWN. Overall, rents increased more slowly in most markets across the country. Starts of new multifamily units reached a plateau in 2016 and have now fallen by about 9 percent through October 2017.

  • THE CHANGING NATURE OF RENTERS. While renters are disproportionately younger and lower-income, growing shares of renters are older and higher-income. For example, the number of renter households earning more than $100,000 per year increased from 3.3 million in 2006 to 6.1 million in 2016.

  • THE CHANGING NATURE OF NEW RENTAL UNITS. Additions to the rental stock are increasingly concentrated at the high end of the market. The share of new units renting for $1,500 or more (in real terms) soared from 15 percent in 2001 to 40 percent in 2016. Additionally, the share of new units renting for less than $850 per month fell from 42 percent of the rental stock to 18 percent. The challenges to building low- and moderate-cost units are most severe in metros like San Jose, San Francisco, Honolulu, and Washington, D.C., where more than 50 percent of all rental units rent for over $1,500 a month.

  • AFFORDABILITY CONTINUES TO BE A MAJOR PROBLEM. Despite rising incomes, nearly half (47 percent) of all renter households (21 million) are cost burdened—meaning they pay more than 30 percent of their income for housing, including 11 million households paying more than 50 percent of their income for housing. While these figures are down slightly from recent years, the number and share of cost-burdened renters is much higher than it was in 2001, when 41 percent (15 million) were cost burdened. Burdens are particularly high in Miami, Los Angeles, New Orleans, and San Diego, where 55 percent or more of renters are cost burdened.

  • AVAILABILITY OF RENTAL ASSISTANCE HAS SHRUNK. Even as low-cost housing units are disappearing, rental assistance is becoming harder to access for very-low-income households. The share of very-low-income households who receive rental assistance declined from 28 percent in 2001 to 25 percent in 2015.

Addressing these challenges—particularly expanding the availability of low- and moderate-cost housing options—will require that all levels of government ensure that the regulatory environment does not stifle innovation, and that tax policy and public spending support the efficient provision of moderately-priced housing.

You can view the full report and interactive metro-level tools here.


LIVE WEBCAST TODAY @ 1pm ET

The release event for America’s Rental Housing 2017, being held today at the Newseum in Washington, DC, will be webcast live from 1:00 – 3:00 p.m. The event will feature keynotes by Senator Maria Cantwell (D-WA) and Pamela Hughes Patenaude, Deputy Secretary, U.S. Department of Housing and Urban Development, as well as a panel discussion moderated by Laura Kusisto, housing reporter for the Wall Street Journal.

For the full agenda or to watch the livestream, visit www.jchs.harvard.edu.

You can also join the conversation on Twitter with #harvardhousingreport

Friday, August 18, 2017

Who Owns Rental Properties, and is it Changing?

by Hyojung Lee
Postdoctoral Fellow
Institutional investors own a growing share of the nation's 22.5 million rental properties and a majority of the 47.5 million units contained in those properties, according to the US Department of Housing and Urban Development's recently released 2015 Rental Housing Finance Survey (RHFS), a survey administered by the Census Bureau. The changes are notable because virtually all of the household growth since the financial crisis has occurred in rental units, with more than half of the growth occurring in single-family rental units.

According to the RHFS, individual investors were the biggest group in the rental housing market in 2015, accounting for 74.4 percent, or 16.7 million rental properties, followed by limited liability partnerships (LLPs), limited partnerships (LPs), or limited liability companies (LLCs) (14.8 percent); trustees for estates (4.1 percent); and nonprofit organizations (1.6 percent) (Table 1). However, because the share of rental properties owned by individual investors tends to decrease with the property size, individual investors owned less than half (47.8 percent) of rental units, followed by LLPs, LPs, or LLCs (33.2 percent), trustees for estates (3.3 percent), real estate corporations (3.3 percent), and nonprofit organizations (3.2 percent).


Source: Rental Housing Finance Survey, 2015.

When combined with data from the 2012 RHFS and the 2001 Residential Finance Survey (RFS), the new data also show that the number and share of rental properties owned by institutional investors increased for all types of properties between 2001 and 2015 (Figure 1). For example, while about a third of properties with 5 to 24 units were owned by non-individual investors in 2001, that share soared to 47 percent in 2012 and about two-thirds in 2015. Similarly, about 66.1 percent of properties with 25 to 49 units were owned by institutional entities in 2001, which rose to 77 percent in 2012 and about 81 percent in 2015.


Source: Residential Finance Survey, 2001; Rental Housing Finance Survey, 2012 and 2015.
Note: The condominiums and mobile homes the 2001 RFS were excluded as they are excluded in the 2012 and 2015 RHFS. Single-family units were not counted in the 2012 RHFS.

While individual investors (often called "mom-and-pop landlords") still owned about three-quarters of all single-family rental properties in 2015, the share of those properties owned by institutional investors rose from 17.3 percent in 2001 to 24.5 percent in 2015. However, during this time, many individual landlords reportedly created their own LLCs and transferred ownership of their property to protect themselves from liabilities and take advantage of tax benefits. As a result, the figures for single-family rentals may understate the number of mom-and-pop landlords.

Finally, the 2015 RHFS also provides useful information about when these changes occurred. Overall, non-individual investors accounted for about 16 percent of rental properties acquired from 1980 to 2004. That changed dramatically in the years after the financial crisis. Non-individual investors bought 28 percent of rental properties sold between 2010 and 2012 and 49.3 percent sold between 2013 and 2015 (Figure 2). Moreover, this shift was particularly pronounced for properties with 1 to 4 units (compared to those with 5 or more units).


Source: Rental Housing Finance Survey, 2015.

Despite potential implications for both renters and the broader housing market, there have been relatively few studies assessing the impacts of changing ownership patterns for rental properties. However, some research suggest that the changes are more than just paperwork. Illustratively, a 2016 discussion paper published by the Federal Reserve Bank of Atlanta reported that large corporate landlords and private equity investors of single-family rental homes in Fulton county, Georgia were far more likely to file eviction notices than small landlords in the county. Hopefully, the changes documented in the 2015 RHFS will spur additional research on how ownership patterns affect such key issues as rental affordability, housing instability, and the upkeep of rental units.

Tuesday, June 27, 2017

Our Disappearing Supply of Low-Cost Rental Housing

by Elizabeth La Jeunesse
Research Analyst
It’s not an illusion: low-cost rental housing in the US is disappearing. And our 2017 State of the Nation’s Housing report has the numbers to prove it.

Using ACS data from 2005 and 2015, our new report shows how gains in the supply of high-end units and losses of low and modest-priced units over the past decade has shifted the entire rental stock toward the high end. Nationwide, the number of units renting for $2,000 or more per month (in constant, inflation-adjusted dollars) nearly doubled between 2005 and 2015, while the number of units renting for below $800 fell by 2 percent (Figure 1).

Figure 1: Across the US

Released in conjunction with the report, our new interactive tool shows how this shift played out differently in the nation’s 100 largest metropolitan areas. Metros reporting the most dramatic losses of units renting for less than $800 per month included Austin, Seattle, Portland, and Denver – all places where apartment markets heated up in recent years.

Austin’s transformation was particularly striking. The number of units with rents under $800 declined by nearly 40 percent (a loss of around 27,000 units), while those with rents at $2,000 or more increased more than three-fold (Figure 2).

Figure 2: Austin

The pattern was similar in Denver, where the number of units renting for under $800 declined by nearly a third, a loss of 31,000 modest-priced rentals, even as the number of units with rents over $2,000 per month tripled, an increase of more than 24,000 units (Figure 3).

Figure 3: Denver


The largest aggregate increases in high-cost rentals took place in the New York, Los Angeles, San Francisco, and Washington DC metro areas. According to ACS data, the New York metro added nearly 250,000 units renting for more than $2,000 per month, while it lost more than 120,000 units renting for less than $800 a month (Figure 4).

Figure 4: New York

Los Angeles underwent a similar shift in rental stock, losing over 94,000 units renting for less than $800 between 2005 and 2015, while gaining over 200,000 high-cost units (Figure 5).

Figure 5: Los Angeles


The San Francisco and Washington DC metropolitan areas both added over 100,000 high-cost rental units. In San Francisco, the highest-cost rental segment (those renting for more than $2,400 per month) underwent particularly rapid growth, rising by 145 percent, from almost 60,000 units in 2005 to more than 146,000 units in 2015. In contrast, the stock of low-priced rentals in the region, which was quite low in 2005, was virtually unchanged over the subsequent decade (Figure 6).

Figure 6: San Francisco


In general, areas with large numbers of assisted rental units saw little or no growth in their stock of low-priced rentals but significant growth in the most expensive units. For example, the number of units renting for less than under $800 in the Boston metro was basically unchanged, while the number of units renting for more than $2,000 grew by 70 percent (Figure 7).

Figure 7: Boston

Because of such shifts, in most metro areas the share of units that rented for less than $800 a month fell between 2005 and 2015. In Austin, for example, the share of units renting for under $800 per month declined from over a third in 2005 to less than 15 percent in 2015. Similarly, the share of units renting for under $800 per month in New York City metro, home to around 3.5 million renter households, dropped from 23 percent of all units in 2005 to just 18 percent in 2015. And in the Washington, D.C. metro, the number of units renting for less than $800 per month dropped from 15 percent in 2005 to just 10 percent in 2015.

In contrast, both the number and the share of low-rent units rose in a few metros, including the Las Vegas, Cleveland, Sacramento, and Detroit metros. These areas tended to have larger numbers of distressed properties as well as lower rates of economic growth and multifamily construction, which combined to hold down the growth in real rents between 2005 and 2015. In Detroit, for example, there was a 17 percent increase in the share of units renting for less than $800 a month and only a small rise in the number of high-rent units (Figure 8).

Figure 8: Detroit


Use our interactive tool to see how the distribution of rental units changed in the nation’s 100 largest metro areas between 2005 and 2015.

Download an Excel file with the data for each metro area (W-16).

Friday, June 16, 2017

Growing Demand and Tight Supply are Lifting Home Prices and Rents, Fueling Concerns about Housing Affordability

A decade after the onset of the Great Recession, the national housing market has, by many measures, returned to normal, according to the 2017 State of the Nation’s Housing report, being released today by live webcast from the National League of Cities. Housing demand, home prices, and construction volumes are all on the rise, and the number of distressed homeowners has fallen sharply. However, along with strengthening demand, extremely tight supplies of both for-sale and for-rent homes are pushing up housing costs and adding to ongoing concerns about affordability (map + data tables). At last count in 2015, the report notes, nearly 19 million US households paid more than half of their incomes for housing (map + data tables).

National home prices hit an important milestone in 2016, finally surpassing the pre-recession peak. Drawing on newly available metro-level data, the Harvard researchers found that nominal prices in real prices were up last year in 97 of the nation’s 100 largest metropolitan areas. At the same time, though, the longer-term gains varied widely across the country, with some markets experiencing home price appreciation of more than 50 percent since 2000, while others posted only modest gains or even declines. These differences have added to the already substantial gap between home prices in the nation’s most and least expensive housing markets (map).

“While the recovery in home prices reflects a welcome pickup in demand, it is also being driven by very tight supply,” says Chris Herbert, the Center’s managing director. Even after seven straight years of  construction growth, the US added less new housing over the last decade than in any other ten-year period going back to at least the 1970s. The rebound in single-family construction has been particularly weak. According to Herbert, “Any excess housing that may have been built during the boom years has been absorbed, and a stronger supply response is going to be needed to keep pace with demand—particularly for moderately priced homes.”

Meanwhile, the national homeownership rate appears to be leveling off. Last year’s growth in homeowners was the largest increase since 2006, and early indications are that homebuying activity continued to gain traction in 2017. “Although the homeownership rate did edge down again in 2016, the decline was the smallest in years. We may be finding the bottom,” says Daniel McCue, a senior research associate at the Center.

Affordability is, of course, key. The report finds that, on average, 45 percent of renters in the nation’s metro areas could afford the monthly payments on a median-priced home in their market area. But in several high-cost metros of the Pacific Coast, Florida, and the Northeast, that share is under 25 percent. Among other factors, the future of US homeownership depends on broadening the access to mortgage financing, which remains restricted primarily to those with pristine credit.

Despite a strong rebound in multifamily construction in recent years, the rental vacancy rate hit a 30-year low in 2016. As a result, rent increases continued to outpace inflation in most markets last year. Although rent growth did slow in a few large metros—notably San Francisco and New York—there is little evidence that additions to rental supply are outstripping demand. In contrast, with most new construction at the high end and ongoing losses at the low end (interactive chart), there is a growing mismatch between the rental stock and growing demand from low- and moderate-income households.

Income growth did, however, pick up last year, reducing the number of US households paying more than 30 percent of income for housing—the standard measure of affordability—for the fifth straight year. But coming on the heels of substantial increases during the housing boom and bust, the number of households with housing cost burdens remains much higher today than at the start of last decade. Moreover, almost all of the improvement has been on the owner side. “The problem is most acute for renters. More than 11 million renter households paid more than half their incomes for housing in 2015, leaving little room to pay for life’s other necessities,” says Herbert.

Looking at the decade ahead, the report notes that as the members of the millennial generation move into their late 20s and early 30s, the demand for both rental housing and entry-level homeownership is set to soar. The most racially and ethnically diverse generation in the nation’s history, these young households will propel demand for a broad range of housing in cities, suburbs, and beyond. The baby-boom generation will also continue to play a strong role in housing markets, driving up investment in both existing and new homes to meet their changing needs as they age. “Meeting this growing and diverse demand will require concerted efforts by the public, private, and nonprofit sectors to expand the range of housing options available,” says McCue.


Live Webcast Today @ Noon ET

Tune into today's live webcast from the National League of Cities in Washington, DC, featuring:

Kriston Capps, Staff Writer, CityLab (panel moderator)
Chris Herbert, Managing Director, Joint Center for Housing Studies
Robert C. Kettler, Chairman & CEO, Kettler
Terri Ludwig, President & CEO, Enterprise Community Partners
Mayor Catherine E. Pugh, City of Baltimore, Maryland

Tweet questions & join the conversation on Twitter with #harvardhousingreport

Friday, May 12, 2017

Cincinnati Event Focuses on Lessons from the PRO Neighborhoods Initiative

by Matthew Arck
Associate Analyst
The challenges—and the unexpected benefits—of collaboration among community development financial institutions (CDFIs) were the subject of a recent gathering in Cincinnati that focused on the experiences of CDFIs that have received funding from the Partnerships for Raising Opportunities in Neighborhoods (PRO Neighborhoods) program, a five-year, $125 million competitive initiative funded by JPMorgan Chase.

Kicking off the event, Karen Keogh, Head of Global Philanthropy at JPMorgan Chase, welcomed civic and non-profit leaders, along with the directors of the award-winning CDFIs to a renovated union hall in Cincinnati’s Over-the-Rhine neighborhood, commenting that the neighborhood, which many of the attendees had a personal hand in revitalizing, was “like Brooklyn, but cooler.” In her remarks, Keogh described JPMorgan Chase’s philanthropic efforts, focused on workforce readiness, small business growth, consumer financial health, and supporting communities and neighborhoods. Part of this last area of focus, the PRO Neighborhoods initiative encourages CDFIs to take on specific community development challenges.

At the event, Alexander von Hoffman, a Joint Center Senior Research Fellow who is examining the initiative’s methods and achievements, and Colleen Briggs, Executive Director of Community Innovation at JPMorgan Chase, discussed findings of the Joint Center’s research on the work of the PRO Neighborhoods recipients. Dr. von Hoffman noted that, according to a Progress Report released last fall, the entities funded by the first seven PRO Neighborhood awards have made $240 million in loans and leveraged another $350 million in additional funding. This funding has helped create 2,400 jobs and produced or preserved 1,600 units of affordable housing. 

These efforts, von Hoffman said, spanned a wide array of programs, partnerships, and places. They ranged from groups like ROC USA, which took its model of helping the residents of manufactured houses purchase their mobile-home parks into new states, to collaborations between diverse programs in specific areas, such as PRO Oakland, which makes loans to small businesses, nonprofit groups, and low-income housing developers along International Boulevard and in downtown Oakland, California. Carrying out complex collaborations in diverse locales, von Hoffman explained, has taught the PRO Neighborhoods group leaders that to succeed they must be flexible, sensitive to markets, and communicate regularly with their partners.

L-R: Charlie Corrigan (Vice President, JPMorgan Chase) moderates as Joe Neri (CEO, IFF) and Jeanne Golliher (CEO, Cincinnati Development Fund) discuss lessons from their CDFI collaboration, the Midwest Nonprofit Lenders Alliance. 


Successful partnerships require strong relationships, added Jeanne Golliher and Joe Neri, the CEOs of Cincinnati Development Fund (CDF) and IFF, two CDFIs that were part of the Midwest Nonprofit Lenders Alliance (MNLA), one of seven entities funded in 2014 via a pilot program that became the PRO Neighborhoods initiative. They explained that MNLA, which is the subject of a recent Joint Center case study, brought together CDF’s local knowledge and IFF’s underwriting expertise to provide long-term facility loans to nonprofits in the Cincinnati and Dayton, Ohio, metro areas. (These included several projects in the Over-the-Rhine neighborhood.) Recounting the “courtship” that led to the CDF and IFF collaboration, Neri and Golliher described how clear communication and commitment to shared values and social goals turned “love at first sight” into a strong and fruitful “marriage.” Neri, for example, noted that Golliher’s passion for the people of Cincinnati ultimately led IFF to provide funding for a homeless shelter that was outside their organizations’ planned collaboration.

In formal and informal discussions at the event, leaders of other entities that have been funded by the PRO Neighborhoods program echoed Golliher and Neri’s remarks. Several participants noted that getting on the same page and hashing out details at the beginning of a collaboration can easily take a full year. This means that potential partners must be patient and probably should build “ramp-up” time into their plans. Extending the relationship metaphor that Neri and Golliher had used, several people also cautioned against “shotgun marriages” between CDFIs who come together only to secure funding from grants. While such partnerships may initially seem like a good idea, poorly thought out collaborations often end in heartbreak, they warned. On the other hand, some participants noted, well-thought out collaborations often go beyond their original scope and foster a sense of commonality and common purpose that led to better engagement with local officials and civic leaders. 

Tuesday, April 25, 2017

Fiduciary Landlords: Life Insurers and Large-Scale Housing in New York City

JCHS Meyer Fellow
For a brief window between the late 1930s and the late 1940s, life insurance companies built approximately 50,000 middle-income rental apartments across the United States. Most were racially-segregated, market-rate projects in semi-suburban locations. Others were central city redevelopment projects, built with the powers of eminent domain and offering below-market-rate rentals. Stuyvesant Town, an 8,755-unit apartment complex in New York City developed by Met Life, is perhaps the most famous of these projects (Figure 1) but there were many others, including Lake Meadows in Chicago (developed by New York Life), Hancock Village in Boston (developed by John Hancock Mutual Life), and the Chellis-Austin Homes in Newark (developed by Prudential).


As corporate entities with access to vast institutional funds, insurers achieved considerable economies of scale in construction, financing, and operation, and accepted longer, lower yields than conventional real estate developers. As such, policymakers hoped that life insurers and other fiduciary institutions, such as savings banks, would play a key role in building and operating large-scale, low-cost urban housing and in modernizing the postwar city more generally. By the early 1950s, however, a combination of disappointing financial returns and bruising controversies over discriminatory leasing drove insurers from the housing field.


The 789-unit Hancock Village, which straddles the Boston-Brookline border, was built in 1946 by the John Hancock Mutual Life Insurance Company. Source: “Greater Boston Housing Development Charted,” Christian Science Monitor, 01/05/1946.

While the volume of life insurance housing soon paled in the face of the postwar suburban boom — built for much the same demographic and often financed by life insurance dollars — insurers’ brief venture into multifamily development represents a significant and understudied episode in the history of affordable housing. With Stuyvesant Town currently enjoying an unexpected renaissance as both high-class investment and public policy touchstone, the time is ripe for a reevaluation of the substantial, if controversial, legacy of life insurance housing.

In a new Joint Center working paper, I provide an overview of the “rise and fall” of life insurance housing in the postwar period, with a focus on New York City, where the majority of insurance-sponsored apartments were located. The paper is part of my larger dissertation project, which examines the political and economic forces that drove various entities — including life insurance companies, labor unions, public authorities, and for-profit developers — to build some of the world’s largest middle-income housing projects in New York in the mid 20th century, as well as the factors that abruptly terminated this “large-scale approach” in the mid-1970s.

In the paper, I argue that when it came to middle-income urban housing, the 1940s represented a moment of unusual convergence between corporate need and municipal interest. While incentives were aligned, thousands of relatively low-cost apartments were built in America’s most expensive housing markets. These apartments proved a panacea for white families who earned too much for public housing but not enough to purchase suburban homes. As soon as civic and corporate needs began to diverge, however, insurance capital moved beyond city limits to suburban jurisdictions offering higher returns with fewer political obstacles. In the context of today’s continued shortage of affordable housing — particularly for middle-income renters in high-cost cities like Boston and New York — the story can be read as both missed opportunity and cautionary tale.

Wednesday, March 22, 2017

Boston Mayor Gives Annual Dunlop Lecture

by David Luberoff
Senior Associate Director
In a more two-decade career that began in the construction trades and now brings him into a host of debates about federal policies, Boston Mayor Martin J. Walsh says he’s “learned a lot about housing: how it gets built, the role it plays in working people’s lives, and the role it plays in community development.”

Walsh, who gave the Joint Center’s 17th Annual John T. Dunlop Lecture on March 20th before more than 300 people at Harvard’s Graduate School of Design, hailed the fact that, in positions that included serving as dean of Harvard’s Faculty of Arts and Sciences and as U.S. Secretary of Labor, John Dunlop “spent his career bringing together academics, government officials, workers, and labor leaders to better understand our shared challenges.” Such collaboration, “is something we could use more of today,” noted Walsh, who added, “I’ve found that kind of dialogue and collaboration to be invaluable throughout my career,” particularly when it comes to housing.


Walsh, who emerged from a crowded field to win Boston’s mayoral race in 2013, said that upon taking office, “one of the first things I confronted was what more and more people were calling a housing crisis. Rents and home prices were rising beyond middle-class, working-class, and low-income people’s budgets.”  Addressing those challenges, he said, not only required setting and achieving ambitious goals, such as building more than 50,000 additional housing units by 2030, but also doing so in ways that go beyond “simply matching housing units to the population, or meeting market-driven demand.”

Rather, he said, “the challenge is to embrace our success as a city while retaining the core values that got us here. Those values center on inclusiveness, on opportunity, on social and economic diversity. We are a community that welcomes all and leaves no one behind. These aren’t just ideals. They are pragmatic needs.” The mayor, who also spoke about city initiatives to provide more housing, reduce homelessness, and address evictions, added that those efforts further highlight “the role of housing not just in community development but also in human development.”

Turning to current debates about the federal budget and other federal policies, Walsh said the Trump administration’s recent budget proposals and other federal initiatives are “an effort to end the system of federal partnerships that date to the New Deal and Great Society commitments of the 1930s [and] the 1960s.”  Left unchecked, he said, such policies would exacerbate the already significant problem of economic inequality in Boston.  Therefore, he added, he and other mayors are actively trying “to educate people on the impacts of inequality, and advocate for solutions” such as “health care; paid family leave and affordable daycare; strong labor laws and fair tax laws; financial regulation; [and] infrastructure investments.”

While these are daunting challenges, the mayor said, “I’m still counseling confidence” because the work the city has done and continues to do puts Boston “in a good position to respond to this moment. Even if the funding arrangements we’ve built seem threatened, the relationships we’ve built are strong. They will produce new solutions and new ideas. They will bring new partners to the table.”  Those partners, he concluded, hopefully will include the many graduate and undergraduate students who attended the lecture. “We are going to need you in the years ahead,” said the mayor.


Watch Mayor Marty Walsh deliver the 2017 Dunlop Lecture.

Wednesday, February 22, 2017

What Can We Learn from Attempts to Reduce the Cost of Affordable Housing?

by Sam LaTronica
Gramlich Fellow
Midwestern CDCs trying to build affordable homes that do not require development subsidies have identified three potentially promising strategies: building smaller homes, utilizing factory-built homes, and creatively designing houses to get more out of them. In a new working paper that grows out my work as an Edward M. Gramlich Fellow in Community and Economic Development I conclude that while each technique presents opportunities for cost savings, each also comes with its own set of challenges.

The fellowship, which is co-sponsored by the Joint Center for Housing Studies and NeighborWorks® America, also expanded my horizons because for years, my conception of new “affordable housing” had been limited to the standard multifamily properties developed in larger urban areas. This was the type of affordable housing I had seen since moving to the Boston area, as well as working for an affordable advocacy organization in the San Francisco Bay Area prior to attending the Harvard Graduate School of Design.

As a Gramlich Fellow in the summer of 2015, I was exposed to a new region and new approach to affordable housing. The Midwestern CDCs, which were part of NeighborWorks® America’s national network, often had in-house general contractors and focused on building and selling affordable single-family homes, in both urban and rural areas. Given the dearth of housing subsidies, particularly subsidies for affordable housing in rural areas, these CDCs were trying to find cost-saving construction techniques that would allow them to build affordable housing without development subsidies.

The Rambler, a single-family home constructed by the Southwest Minnesota Housing Partnership. The home is 1,092 square feet on the main floor with another 1,092 square feet of unfinished basement space that can be converted into living space or more bedrooms at a later date. This home was constructed in 2014 with an asking price of $153,900.

Through reading popular literature on home construction, analyzing building trends, conducting interviews with CDC leaders, and visiting new developments in the Midwest, it became clear that CDCs were interested in pursuing three potential cost saving techniques: building smaller homes, using factory-built homes, and creatively designing houses to get more out of them.

Smaller homes are theoretically cheaper to build because they simply require fewer materials and less construction time. Once occupied, these houses not only can be cheaper to heat or cool but also will cost less to maintain. Smaller footprints also make it possible to build these homes on smaller or irregularly shaped lots, which helps expand the options for CDCs.

However, cost savings are not always realized when buildings are smaller. Once land and other development costs are factored in, it is possible that building smaller homes will be only slightly cheaper than building larger homes on the same lot. Moreover, the marginal cost of constructing a few hundred more square feet might allow the CDC to sell the house for more money while still keeping it affordable. Some CDC leaders also worry that producing affordable homes that are much smaller than new market-rate homes would create obvious distinctions between income levels and stigmatize the people living in the new, smaller homes. Finally, while building smaller can be smart for a number of reasons, most people still want bigger homes as evidenced by the fact that average house sizes have been increasing and have recently surpassed pre-recession levels. This suggests that without a shift in the overall market, smaller homes may not be a particularly appealing option for CDCs trying to build affordable housing.

While factory-built construction techniques are not necessarily new, they are new to many CDCs. Many Midwestern CDCs are currently experimenting with (or exploring the possibility of using) both modular homes and homes made from structural insulated panels (SIPs). Factory-built homes have the benefit of being produced mostly indoors and using assembly line techniques, which can significantly reduce onsite construction time and protect against weather delays, theft, vandalism, etc. Moreover, homes built in factory-controlled settings can be tighter and more energy efficient and make more efficient usage of building materials (which should reduce their cost).

Like building smaller, however, the cost savings that are touted in popular literature are harder to realize in practice. If CDCs, architects, contractors, and subcontractors do not have enough experience working with factory-built housing, then the development process can hit major roadblocks that negate the hypothetical cost savings that would result from a shorter construction period and lower production costs. In fact, some CDCs that experimented with these techniques ended up with homes that cost far more than they would have cost using traditional stick-built techniques.

Finally, creatively designing houses can supplement the previous construction types to get the most out of new homes. This can come in many forms. Designing attached accessory dwelling units will add more units to the housing stock and can supplement the primary tenant’s income.  Co-housing development can utilize scale and reduce the per-owner development costs. Open floor plans can make smaller homes more palatable and unfinished buildouts can reduce costs while allowing families to later customize their home to meet their particular needs.

In the end, there is no silver bullet that can be used to build affordable single-family homes without a development subsidy. However, there are many techniques that, when combined, could produce significant cost savings. CDC leaders interested in pursuing these approaches should remember that the benefits of these techniques, as described in popular literature, do not always materialize in practice. Therefore, CDC leaders should learn from others who have already experimented with them. They should also establish strong relationships with architects and contractors who have experience with these techniques, so that they reduce the likelihood of delays that would drive up costs. Hopefully, by persevering and learning from others, the CDCs can increase the production of affordable homes.

Sam LaTronica, who graduated from the Harvard Graduate School of Design in 2016, was a 2015 recipient of the TheEdward M. Gramlich Fellowship in Community and Economic Development, which is co-sponsored by NeighborWorks®America and the Joint Center for Housing Studies.