Showing posts with label equity. Show all posts

Thursday, December 21, 2017

What Would it Take to Make Neighborhoods More Equitable and Integrated?

by Katie Gourley, Graduate Research Assistant

How do household decisions about where to live perpetuate residential segregation, and what would it take for such choices to result in more inclusive neighborhoods? Three papers released today by the Joint Center for Housing Studies explore these questions from somewhat different perspectives. The newly released papers, which were presented at A Shared Future: Fostering Communities of Inclusion in an Era of Inequality, a symposium hosted by the Joint Center, include an overview paper by the panel’s moderator and two papers by panelists examining key issues in more detail. The papers are:


MIT
Household Neighborhood Decisionmaking and Segregation, an overview paper co-authored by Justin Steil, the panel’s moderator, and Reed Jordan, investigates what we know about households’ decisionmaking processes and explores the ways that technology and other interventions might help create more integrated places. They note that notwithstanding the significance of schools and other local amenities, the racial composition of a neighborhood is a significant determinant in the residential decisionmaking process. Moreover, they add, while homeseekers increasingly rely on the internet, it is not yet clear how that reliance impacts the makeup of neighborhoods. However, they note, it seems clear that different sources of information have implications for segregation and may serve as points of leverage for pro-integration interventions.

Trulia
Data Democratization and Spatial Heterogeneity in the Housing Market, by Ralph McLaughlin and Cheryl Young, argues that improved access to residential real estate data has the potential to affect residential settlement patterns in two countervailing ways. On the one hand, it could expand individuals’ housing search choice to include properties in more diverse neighborhoods. Alternatively, it could increase the demand to live in amenity-rich locations, which might price out existing and future residents (unless the supply of housing in those locations grew at a similar rate). However, they argue, the extent to which households might be priced out of a neighborhood is not primarily influenced by data availability but rather by the ease with which housing supply can be increased to meet demand in those areas. They therefore recommend three policy approaches: reducing exclusionary and restrictive zoning policies in expensive, amenity-laden markets; giving housing choice voucher (HCV) recipients the option to conceal their voucher status from landlords during the application process; and requiring that some available Low Income Housing Tax Credit funds be used in “high-value” Census tracts.


Tarry Hum,
Queens College
Minority Banks, Homeownership, and Prospects for New York City's Multi-Racial Immigrant Neighborhoods, by Tarry Hum, focuses on the role of Asian minority banks in in lending to Asian borrowers for residential property purchases in Queens and Brooklyn. Established to counter financial exclusion resulting from discrimination and linguistic and cultural barriers, these banks historically have been a key source of credit, especially for Asian immigrants who may not qualify for conventional loans. However, using data sets from 2010 and 2015, Hum shows that there was a significant rise in lending by these banks to investors rather than owner-occupants. She concludes by exploring how these changes may be driving up prices, displacing low- and moderate income renters, and spurring illegal conversions – changes that together may be destabilizing many of the neighborhoods where the loans are being made.

The three papers build on previously released papers from the symposium that discuss the nature of residential segregation in the US, its consequences, rationales for public policies to address those consequences, and priorities for action. Over the next several months, the Joint Center will be releasing additional papers from the symposium that will focus on promising strategies in a variety of areas that would help foster more inclusive residential communities. The papers also will be collected into an edited volume that will be published in 2018.


Additional papers from the A Shared Future symposium are available on the JCHS website. 

Friday, December 16, 2016

Rising Interest Rates, and What They Mean for Home Improvement

by Kermit Baker
Director, Remodeling
Futures Program
The recent hike in short-term interest rates by the Federal Reserve Board has raised concerns about what rising interest rates mean for consumer borrowing, particularly how they will affect the demand for home improvement loans. The counterintuitive but probable outcome is that home improvement borrowing is likely to increase, and that borrowers will rely more heavily on loans tied to short-term interest rates, which are expected to rise significantly over the coming year.

Why is this likely to occur?  To begin, it is worth noting that owners undertaking home improvement projects, even larger projects, rely heavily on savings to pay for these projects. Findings from a October 2016 Piper Jaffray Home Improvement Survey are consistent with previous consumer surveys regarding how owners pay for major home improvement projects. Savings continue to be the principal source of funds as 62 percent of respondents planning a project indicated that they would use savings for all or part of the payment. Another 37 percent said they would put all or part of the cost on a credit card, with many of these planning to immediately pay off their balance. In contrast, only 18 percent said they planned to use a home equity line of credit to fully or partially fund their projects.

The relatively low use of home equity loans, which has in fact been trending up in recent years, is due in part to the facts that home equity levels for homeowners fell dramatically after the housing crash and lenders became more restrictive with home equity lending. However, there is another reason why these loans have fallen sharply since the housing crash. Long-term interest rates have been trending down for the past decade, and many owners who want to borrow to finance a home improvement project had another appealing and readily available option: they could refinance their principal mortgage to take advantage of lower rates, and simultaneously pull out some of their equity by increasing the loan amount on their low-interest, fixed-rate, first mortgage.

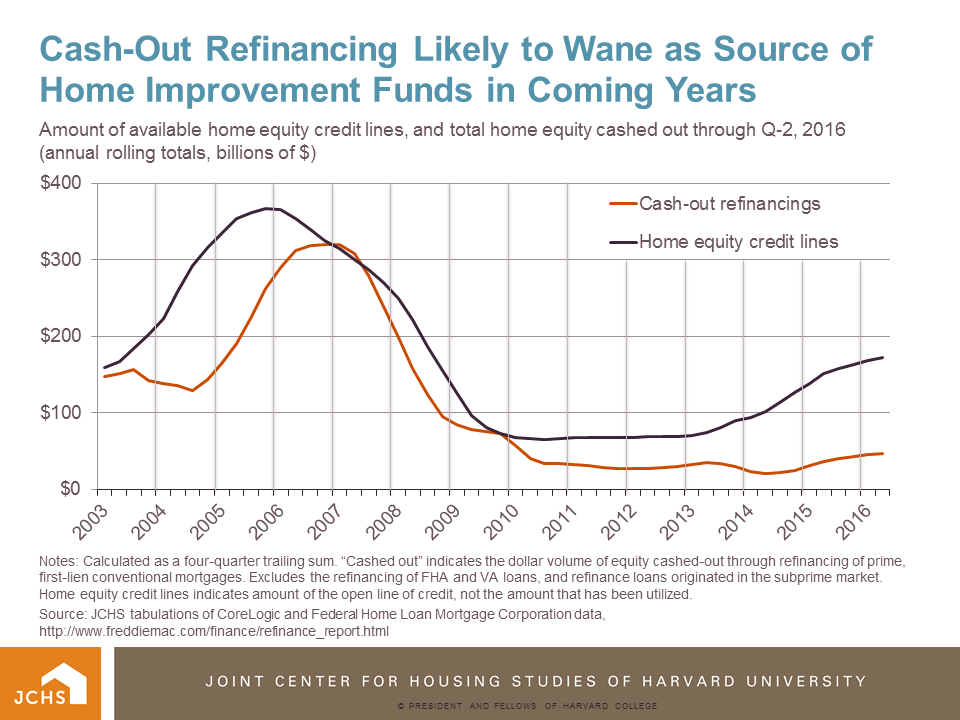
For much of the past decade, the volume of cash-out refinancing has just about equaled borrowing available through home equity credit lines. However, signs are quite clear now that we are at the end of this near decade-long interest rate down cycle. Interest rates on 30-year fixed rate mortgages, which have been trending up since last summer, spiked almost 50 basis points (one-half percentage point) after the presidential election. Noting that the incoming Trump administration is likely to push for tax cuts and infrastructure spending increases, most forecasters are projecting that long-term interest rates will continue to rise in 2017.

While higher interest rates will discourage some owners from cashing out home equity to undertake home improvement projects, they may actually promote remodeling spending by others. How can this be the case? Rising mortgage rates may encourage many owners to remain in their current homes. Interest rates for 30-year fixed rate mortgages have been below 5 percent since early 2011, so virtually everyone who has purchased a home or refinanced their fixed rate mortgage over the last six years has locked into a historically low mortgage rate. This means that if rates rise, trading up to a more desirable home also involves paying off a low interest mortgage and taking out a new higher rate loan. Facing this prospect, many owners may instead decide to improve their current home rather than buying a home with the features they now desire.

Those owners who want to tap into their growing levels of home equity to finance their home improvement projects are likely to rely on home equity lines of credit rather than cash-out refinancing. As long-term rates have stabilized near their cyclical low, we’ve already seen that homeowners are starting to rely more on home equity credit lines. In the coming months as rates trend up, the gap between home equity borrowing and cash-out refinancing is likely to widen, which, unfortunately, will expose these home equity borrowers to future hikes in short-term rates.

 Click to enlarge

Notes: Calculated as a four-quarter trailing sum.“Cashed out” indicates the dollar volume of equity cashed-out through refinancing of prime, first-lien conventional mortgages. Excludes the refinancing of FHA and VA loans, and refinance loans originated in the subprime market. Home equity credit lines indicates amount of the open line of credit, not the amount that has been utilized.


Source: JCHS tabulations of CoreLogic and Federal Home Loan Mortgage Corporation data, http://www.freddiemac.com/finance/refinance_report.html

Thursday, January 21, 2016

Home Remodeling Activity Looking to Gain Steam Through Mid-Year

Abbe Will
Research Analyst
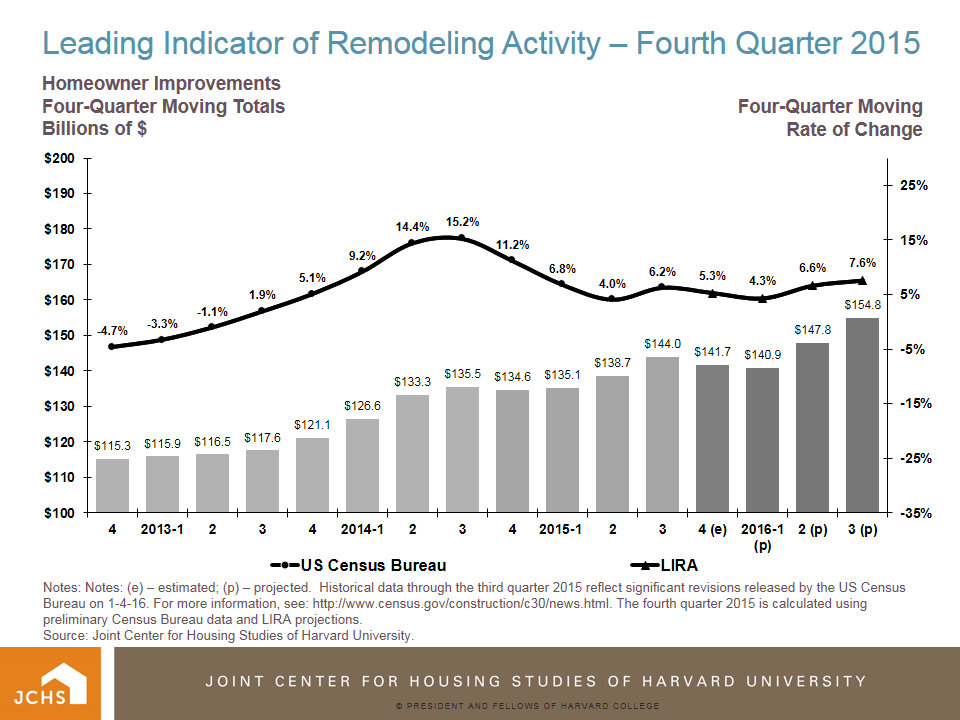
Expenditures for home improvements should see healthy gains in 2016, according to the Leading Indicator of Remodeling Activity (LIRA) released today by the Remodeling Futures Program at the Joint Center for Housing Studies of Harvard University. The LIRA projects annual spending growth for home improvements will accelerate from 4.3% in the first quarter of 2016 to 7.6% in the third quarter. By then, the level of annual spending in nominal terms is anticipated to surpass the previous peak set in 2006.

2016 is looking to be a stronger year for home renovation activity compared to 2015 thanks to the continued recovery in the owner-occupied housing market. In most markets across the country, rising house prices are bringing more homes to the market and increasing sales, which is a large driver of home improvement activity.


The remodeling market has steadily improved in recent years with homeowners incorporating larger, more discretionary projects into their home improvement priorities. The real test this year will be whether the industry can clear ongoing bottlenecks in labor availability and consumer financing concerns to fully meet this increased demand.  (Click chart to enlarge.)

Notes: (e) – estimated; (p) – projected.  Historical data through the third quarter 2015 reflect significant revisions released by the US Census Bureau on 1-4-16. For more information, see: http://www.census.gov/construction/c30/news.html. The fourth quarter 2015 is calculated using preliminary Census Bureau data and LIRA projections.
Source: Joint Center for Housing Studies of Harvard University. 

--
For more information about the LIRA, including how it is calculated, please visit the Joint Center for Housing Studies website.

Tuesday, November 4, 2014

Why Does Mortgage Debt Continue to Rise Among Older Homeowners?

by George Masnick
Senior Research Fellow
According to the Federal Reserve Bank of New York, aggregate mortgage debt stood at $8.6 trillion in Q2 2014, down from its peak of $10.0 trillion in Q3 2008. Many have interpreted this decline as a sign that consumers have become chastened by the Great Recession’s bursting of the housing bubble and are voluntarily paying down their mortgage debt to more sustainable levels. For those thinking in such terms, I recommend a paper further analyzing the same Consumer Credit Panel data that produces the aggregate debt estimates just cited. In a masterful exercise, Fed economist Neil Bhutta concludes that the recent drop in mortgage debt has more to do with shrinking inflows than with expanding outflows, including mortgage defaults:

"While few borrowers, compared to prior years, have been increasing their mortgage debt, they also do not appear to be aggressively paying down their mortgages… It is therefore possible that many borrowers might actually be credit constrained (they would like to increase their debt, but cannot find a willing lender …).” (p. 3)

A critical limitation of the Fed’s Consumer Credit Panel data is that it includes very limited demographic information (only the age of the borrower). But Bhutta’s findings are supported by a recently released Census Bureau report on the growing wealth inequality in the U.S. that reports on trends in mortgage debt broken down by a wide variety of household demographic characteristics. These data, collected by the Survey of Income and Program Participation (SIPP), clearly show a post-Great Recession decline in the share of young households with home debt (Figure 1) – consistent with a dramatic slowing of movement into first-time homeownership. At the same time, the report also shows that the percentage of older households with home debt has continued to increase. Since 2000, the share of homeowners aged 65-69 with home debt increased by almost 33 percent, and the share of those aged 70-74 increased by almost 65 percent. This trend is consistent with today’s older owners failing to pay down their mortgages as diligently as did earlier generations. Both equity extractions to garner cash to pay for other expenditures, and simple refinancing and extending the payment period to lower monthly payment costs will slow the pace at which homeowners pay off their mortgages.


Source: Census Bureau tabulations of Survey of Income and Program Participation (SIPP) data

Moreover, among those households with home debt, overall median debt outstanding has continued to increase post-Great Recession, albeit at a diminished pace (Figure 2). The increase in median home debt is especially true among the elderly. Median outstanding home debt for homeowners aged 65-69 with a mortgage increased by 46 percent between 2000 and 2005, and another 8 percent between 2005 and 2011. The corresponding figures for 70-74 year old owners with home debt are 18 and 33 percent. This doesn’t necessarily indicate a recent rise in refinancing activity among these older households. Rather it likely is attributable to the aging of 60-64 and 65-69 year olds (with higher mortgage debt from the previous periods) into the 65-69 and 70-74 age groups.


Source: Census Bureau tabulations of Survey of Income and Program Participation (SIPP) data

Growing mortgage debt among the elderly is troubling. Declining income later in life is inevitable for most households. With mortgage payments a continuing part of the monthly household budget, in addition to real estate taxes and the expense of home repairs, many elderly with high housing cost burdens will need to postpone retirement or spend less on other needs like food or health care. Fewer will be able to draw on wealth accumulated through growth in home equity to help pay the bills late in life. Some will let their homes fall into disrepair or will be forced to sell their homes when they would prefer to age in place. This is a trend worth our continuing attention and concern. 

Thursday, April 18, 2013

Momentum Building for Home Improvement Activity

by Abbe Will
Research Analyst
Spending by homeowners on improvement projects is expected to accelerate as the year progresses, according to our latest Leading Indicator of Remodeling Activity (LIRA).  On top of the almost 10% growth reflected in U.S. Census Bureau figures for 2012, the LIRA projects strong gains in homeowner remodeling spending continuing throughout 2013, with some moderation in the pace of growth toward the end of the year.

Existing home sales were up almost 9% last year, and house prices are increasing in most markets across the country. This has increased the home equity levels for most homeowners, encouraging them to reinvest in their homes.

The strong growth that we’ve seen recently is putting pressure on the current capacity of the home improvement industry. Contractors and subcontractors are having more difficulty finding skilled labor, and building materials costs are unusually volatile for this stage of a recovery.


For more information about the LIRA, including how it is calculated, visit the Joint Center website.

Friday, April 5, 2013

How Much Did LTVs Actually Rise During the Housing Boom?

by Chris Herbert
Research Director
The rise in housing prices that appears to be taking hold in many parts of the country is an important sign of recovery in the market. Among the many ways the upturn in prices is helping the housing market heal is by turning back the tide on the 100-year flood of underwater mortgages.  Still, even as reports from CoreLogic and Zillow document the progress in reducing the inventory of homes with negative equity, these same reports remind us that despite recent improvements there are still millions of housing units saddled with mortgage debt exceeding the value of the home. These homes serve as a warning about the risks of excessive loan to value ratios (LTVs) that are assumed to have become commonplace among homeowners during the housing boom. However, a review of data from the Survey of Consumer Finances (SCF) from the last 20 years finds that there was actually relatively little change in the distribution of LTVs through the boom years.  While outstanding mortgage debt did increase substantially, it essentially kept pace with the rise in home prices. The flood of underwater owners was thus less the result of a greater share of owners having little equity cushion and more the result of the tremendous collapse in housing prices.

Figure 1 shows  trends in the distribution of LTVs among all homeowners between 1989 and 2010, based on a comparison of total outstanding mortgage debt to owners’ estimates of the value of their principal residence. As shown, there was a fairly substantial increase in the average LTV between 1989 and 1995 from 27 percent to 34 percent. This rise reflects a combination of factors, including the greater tendency of households to hold mortgage debt in the wake of the 1986 Tax Act that gave preferential treatment to mortgage interest payments, the sharp fall in house prices in some areas of the country, and an expansion of mortgage lending that occurred as the economic boom of the 1990s began. However, between 1998 and 2007 the average remained largely unchanged at about 37 percent. Average mortgage debt did increase sharply over this period, from $67,000 to $111,000 (in constant 2010 dollars) but the average house value also increased substantially from $185,000 to $317,000. Even at the peak of the boom, the vast majority of owners still had fairly low LTVs.

Source: Joint Center tabulations of Survey of Consumer Finances.

Of course, these averages include a large share of households that continued to hold little or no mortgage debt. The stable average may result from a rise in high LTVs among some owners that is counterbalanced by plunging LTVs for those who did not tap their growing home equity. But there was also little change in the level of LTVs at the upper end of the distribution. As Figure 1 illustrates, at the 75th percentile of owners LTVs also remained largely unchanged between 1998 and 2007 at roughly 67 percent. Even at the 90th percentile of the distribution LTVs held steady at 86 percent.  Thus, even at the height of the housing boom the vast majority of homeowners had at least a 15 percent equity cushion, as they had continuously since the mid 1990s.

The data in Figure 1 includes homeowners of all ages, but it might be expected that highly leveraged homeownership was becoming more common among younger households who were more likely to buy homes during the boom years and take advantage of more liberal lending. Figure 2 shows the same distributions of LTVs for homeowners under age 30. While there is more sampling variability for this subgroup, there does appear to be more of a rise in average LTVs among this group than is true of all households. Between 1995 and 2001 the average LTV was generally a little above 60 percent, but rose to more than 65 percent in 2004 and 2007. A similar increase was evident at the 75th percentile where LTVs reached about 90 percent during the boom years after having been closer to 85 percent during the 1990s. Still, the vast majority of young homeowners had at least 10 percent equity invested in their homes even when lending standards were most relaxed. There was more stability at the 90th percentile of the distribution, where young homeowners had LTVs of between 95 and 98 percent consistently since 1989. At this upper point of the distribution young homeowners did have little equity in their home, but this was no different during the boom than it was 20 years ago.

Source: Joint Center tabulations of Survey of Consumer Finances.

As both Figures 1 and 2 illustrate, when the bottom fell out of the housing market after 2007 LTVs among homeowners shot up.  According to estimates from the SCF, 9 percent of all homeowners were underwater on their principal residence as of 2010, with the rate more than twice as high among those under age 30. But this sharp rise in LTVs was the result of the unprecedented fall in house prices and not due to an expansion of excessively high LTVs during the boom.

Still, there is no question that homeowners took on much more debt than was prudent during the boom. While outstanding mortgage debt may have been keeping pace with house prices, the level of debt was greatly outracing trends in incomes. This great expansion of credit decoupled from borrowers’ incomes certainly played a role in helping to inflate the housing bubble. The new Qualified Mortgage (QM) standard is designed to avoid this problem in the future by establishing an ability to pay standard for mortgage lending. Notably, the QM standard did not include restrictions on LTVs. However, the still to be announced rules defining the Qualified Residential Mortgage (QRM) may introduce limits on LTVs. While it is true that a greater equity cushion would have helped both homeowners and lenders avoid losses during the housing crash, the housing market has long been characterized by fairly high LTVs at the upper end of the distribution. These higher LTVs were not problematic as long as house prices were not subject to extreme swings. Imposing more stringent LTV requirements are of concern as they will curtail the ability of young households to get a start as homeowners—particularly the growing share of young minority households who have not benefited to the same degree from having parents build wealth through homeownership. Given these concerns, it may be best to have regulatory efforts focus on ensuring that borrowers can afford their mortgages as a means of introducing more stability in the mortgage system, rather than on setting standards for LTVs meant to withstand the next 100-year flood.