Showing posts with label construction. Show all posts

Monday, July 24, 2017

We're Finally Building More Small Homes, but Construction Remains at Historically Low Levels

by Alexander Hermann
Research Assistant
Census data released last month show that after years of stagnation, construction of smaller homes grew appreciably in 2016. New completions for homes under 1,800 square feet increased nearly 20 percent in 2016 to 163,000 units, the first significant growth since 2004 and the largest rise since the data series began in 1999.

This growth is significant because many first-time and lower-income homebuyers hope to purchase smaller homes, which are generally less expensive than larger ones. Moreover, historically-low levels of home construction over the last decade have led to declining inventories, decreasing vacancy rates, and increasing prices, as discussed in our latest State of the Nation's Housing report (Figure 1).


Even with the uptick in 2016, though, small-home construction remains 65 percent below the 464,000 units completed annually between 1999 and 2006, and comprises a much smaller share of newly-built housing than in the past. In 2016, small homes were 22 percent of single-family completions, well below their 37 percent market-share in 1999. In contrast, the share of large homes built grew from 17 percent in 1999 to 30 percent in 2016, while moderately-sized homes, which have consistently been the largest share of the market, have annually been 43-to-48 percent of all new single-family homes.

Construction of condos and townhouses, possible alternatives to smaller single-family housing, also remains low. Builders of multifamily properties continue to focus on the rental market where demand remains strong. Consequently, only 28,000 condos were started in 2016, a modest increase from the 26,000 starts in 2015 but much lower than the 53,000 starts averaged annually in the 1990s (Figure 2). Similarly, townhouse starts grew from 86,000 units in 2015 to 98,000 units in 2016. While this is more than double the number of starts from 2009 and comparable to the 95,000 units started annually in the 1990s, it is less than half the number started in 2005.


The low levels of new construction have resulted in historically-low housing inventories, especially entry-level housing. According to data from CoreLogic, the supply of modestly-priced homes – those selling for 75-to-100 percent of the area's median list price – was below three months at the end of 2016, about half of the six months that generally represents a balanced market (Figure 3). Indeed, according to data compiled by Zillow, only a quarter of the homes for sale at the end of last year were in the bottom one-third of area homes by price, while half were in the top one-third.


Increased demand for entry-level housing and the corresponding uptick in smaller housing construction have already contributed to the growing number of first-time homebuyers in 2016. According to the National Association of Realtors, first-time homebuyers comprised 35 percent of home sales in 2016, up from 32 percent in 2015 but still below long-term historical rates, which are close to 40 percent of all buyers. Looking forward, increases in the supply of smaller homes, townhouses, and possibly condos could help address the growing demand for lower priced homes for first-time and low-income homebuyers.

Thursday, July 20, 2017

Steady Gains in Remodeling Activity Moving into 2018

by Abbe Will
Research Associate
Healthy and stable growth in home improvement and repair spending is anticipated for the remainder of the year and into the first half of 2018, according to our latest Leading Indicator of Remodeling Activity (LIRA), released today. The LIRA projects that annual increases in remodeling expenditures will soften somewhat moving forward, but still remain at or above 6.0 percent through the second quarter of 2018.

The remodeling market continues to benefit from a stronger housing market and, in particular, solid gains in house prices, which are encouraging owners to make larger investments in their homes. Yet, weak gains in home sales activity due to tight inventories in many parts of the country is constraining opportunities for more robust remodeling growth given that significant investments often occur around the time of a sale.

Even with some easing this year, the remodeling market is still expected to grow above its long-term average. Over the coming 12 months, national spending on improvements and repairs to the owner-occupied housing stock is projected to reach fully $324 billion.


For more information about the LIRA, including how it is calculated, visit the JCHS website.

Tuesday, June 27, 2017

Our Disappearing Supply of Low-Cost Rental Housing

by Elizabeth La Jeunesse
Research Analyst
It’s not an illusion: low-cost rental housing in the US is disappearing. And our 2017 State of the Nation’s Housing report has the numbers to prove it.

Using ACS data from 2005 and 2015, our new report shows how gains in the supply of high-end units and losses of low and modest-priced units over the past decade has shifted the entire rental stock toward the high end. Nationwide, the number of units renting for $2,000 or more per month (in constant, inflation-adjusted dollars) nearly doubled between 2005 and 2015, while the number of units renting for below $800 fell by 2 percent (Figure 1).

Figure 1: Across the US

Released in conjunction with the report, our new interactive tool shows how this shift played out differently in the nation’s 100 largest metropolitan areas. Metros reporting the most dramatic losses of units renting for less than $800 per month included Austin, Seattle, Portland, and Denver – all places where apartment markets heated up in recent years.

Austin’s transformation was particularly striking. The number of units with rents under $800 declined by nearly 40 percent (a loss of around 27,000 units), while those with rents at $2,000 or more increased more than three-fold (Figure 2).

Figure 2: Austin

The pattern was similar in Denver, where the number of units renting for under $800 declined by nearly a third, a loss of 31,000 modest-priced rentals, even as the number of units with rents over $2,000 per month tripled, an increase of more than 24,000 units (Figure 3).

Figure 3: Denver


The largest aggregate increases in high-cost rentals took place in the New York, Los Angeles, San Francisco, and Washington DC metro areas. According to ACS data, the New York metro added nearly 250,000 units renting for more than $2,000 per month, while it lost more than 120,000 units renting for less than $800 a month (Figure 4).

Figure 4: New York

Los Angeles underwent a similar shift in rental stock, losing over 94,000 units renting for less than $800 between 2005 and 2015, while gaining over 200,000 high-cost units (Figure 5).

Figure 5: Los Angeles


The San Francisco and Washington DC metropolitan areas both added over 100,000 high-cost rental units. In San Francisco, the highest-cost rental segment (those renting for more than $2,400 per month) underwent particularly rapid growth, rising by 145 percent, from almost 60,000 units in 2005 to more than 146,000 units in 2015. In contrast, the stock of low-priced rentals in the region, which was quite low in 2005, was virtually unchanged over the subsequent decade (Figure 6).

Figure 6: San Francisco


In general, areas with large numbers of assisted rental units saw little or no growth in their stock of low-priced rentals but significant growth in the most expensive units. For example, the number of units renting for less than under $800 in the Boston metro was basically unchanged, while the number of units renting for more than $2,000 grew by 70 percent (Figure 7).

Figure 7: Boston

Because of such shifts, in most metro areas the share of units that rented for less than $800 a month fell between 2005 and 2015. In Austin, for example, the share of units renting for under $800 per month declined from over a third in 2005 to less than 15 percent in 2015. Similarly, the share of units renting for under $800 per month in New York City metro, home to around 3.5 million renter households, dropped from 23 percent of all units in 2005 to just 18 percent in 2015. And in the Washington, D.C. metro, the number of units renting for less than $800 per month dropped from 15 percent in 2005 to just 10 percent in 2015.

In contrast, both the number and the share of low-rent units rose in a few metros, including the Las Vegas, Cleveland, Sacramento, and Detroit metros. These areas tended to have larger numbers of distressed properties as well as lower rates of economic growth and multifamily construction, which combined to hold down the growth in real rents between 2005 and 2015. In Detroit, for example, there was a 17 percent increase in the share of units renting for less than $800 a month and only a small rise in the number of high-rent units (Figure 8).

Figure 8: Detroit


Use our interactive tool to see how the distribution of rental units changed in the nation’s 100 largest metro areas between 2005 and 2015.

Download an Excel file with the data for each metro area (W-16).

Wednesday, June 21, 2017

Wait... What? Ten Surprising Findings from the 2017 State of the Nation’s Housing Report

by Daniel McCue
Senior Research Associate

Every year, when we release our State of the Nation’s Housing report, we’re asked some variation of the question: “What surprised you in this year’s report?” Given all the time and effort that goes analyzing the data and writing the report, we are so close to it that little surprises us by the time of publication. Nevertheless, here are 10 findings in this year’s report that were new and maybe even a bit surprising:

1. For-sale inventories dropped even lower over the past year.   


For the fourth year in a row, the inventory of homes for sale across the US not only failed to recover, but dropped yet again. At the end of 2016 there were an historically low 1.65 million homes for sale nationwide, which at the current sales rate was just 3.6 months of supply - almost half of the 6.0 months level that is considered a balanced market.

2. Fewer homes were built over the last 10 years than any 10-year period in recent history.

Even with the recent recovery in both single-family and multifamily construction, markets nationwide are still feeling the effects of the deep and extended decline in housing construction. Over the past 10 years, just 9 million new housing units were completed and added to the housing stock. This was the lowest 10-year period on records dating back to the 1970s, and far below the 14 and 15 million units averaged over the 1980s and 1990s.


3. Single-family construction grew at a faster pace than multifamily construction.

The slow recovery in single-family construction picked up its pace in 2016. For the first time since the Great Recession, the rate of growth in single-family construction outpaced multifamily construction.

4. Smaller homes may be coming back.
Behind the growth in single-family construction, and as a new development in 2016, construction of smaller homes is back on the rise. The median square footage of newly completed single-family homes declined slightly, due to increase in construction of smaller-sized homes (less than 1,800 sqft).
 
5. Rental markets are still strong.  

Although there are signs of moderation, the slowdown in multifamily rental markets appears to be limited, so far, to a small number of markets. Indeed, last year, multifamily construction levels were still on the rise in most of the country, rents declined in just 10 of the 100 markets, multifamily loan originations and lending volumes both hit new record highs, and rental vacancy rates were at a 30-year low.

6. Long-term, metro-area home price trends show surprisingly wide variations.

Home prices have rebounded widely across the nation. In 2016, prices were up in 97 of 100 metros, and 41 metros had regained their nominal peak price levels from the mid-2000s. Over the longer period of time, however, the combined impact of the boom and bust has resulted in significant differences in home price appreciation across the country. In some metros (particularly on the coasts) real home prices have grown by 50 percent or more since 2000, while prices in 16 of the top 100 metros (mainly in the Midwest and South) were below 2000 levels, after adjusting for inflation.

7. The 12-year decline in the US homeownership rate may be nearing an end.

Homeownership rates flattened last year and the number of homeowners increased for the first time since 2006, suggesting trends in homeownership may be strengthening. In addition, first-time homebuyers accounted for a higher share of sales in 2016 than the year before. Still, lending remained skewed to highest credit score borrowers.

8. The homeownership gap between whites and African-Americans widened to its largest disparity since WWII.

The post-2004 decline in homeownership has been especially severe for African-Americans and has pushed black homeownership rates to fully 29.7 percentage points lower than that for whites. Comparing census data going back to WWII, the white-black difference in homeownership rates has never been wider.

9. More than half of all poor now live in high-poverty neighborhoods.

Poverty is growing, concentrating, and suburbanizing all at the same time. Overall, the total number of people living in poverty in the US increased by nearly 14 million in 2000-2015. Moreover, 54 percent of the nation’s poor live in high-poverty neighborhoods (those with poverty rates over 20 percent).

10. Poverty is growing across metros and in rural areas.

Poverty has been on the rise throughout cities, suburbs, and rural areas. Indeed, while the number of poor living in high-poverty tracts in dense, urban areas grew by 46 percent between 2000 and 2015, the number of poor living in high-poverty tracts in moderate- and lower density suburban areas more than doubled.

Read the full State of the Nation’s Housing report on our website.

Wednesday, March 22, 2017

Boston Mayor Gives Annual Dunlop Lecture

by David Luberoff
Senior Associate Director
In a more two-decade career that began in the construction trades and now brings him into a host of debates about federal policies, Boston Mayor Martin J. Walsh says he’s “learned a lot about housing: how it gets built, the role it plays in working people’s lives, and the role it plays in community development.”

Walsh, who gave the Joint Center’s 17th Annual John T. Dunlop Lecture on March 20th before more than 300 people at Harvard’s Graduate School of Design, hailed the fact that, in positions that included serving as dean of Harvard’s Faculty of Arts and Sciences and as U.S. Secretary of Labor, John Dunlop “spent his career bringing together academics, government officials, workers, and labor leaders to better understand our shared challenges.” Such collaboration, “is something we could use more of today,” noted Walsh, who added, “I’ve found that kind of dialogue and collaboration to be invaluable throughout my career,” particularly when it comes to housing.


Walsh, who emerged from a crowded field to win Boston’s mayoral race in 2013, said that upon taking office, “one of the first things I confronted was what more and more people were calling a housing crisis. Rents and home prices were rising beyond middle-class, working-class, and low-income people’s budgets.”  Addressing those challenges, he said, not only required setting and achieving ambitious goals, such as building more than 50,000 additional housing units by 2030, but also doing so in ways that go beyond “simply matching housing units to the population, or meeting market-driven demand.”

Rather, he said, “the challenge is to embrace our success as a city while retaining the core values that got us here. Those values center on inclusiveness, on opportunity, on social and economic diversity. We are a community that welcomes all and leaves no one behind. These aren’t just ideals. They are pragmatic needs.” The mayor, who also spoke about city initiatives to provide more housing, reduce homelessness, and address evictions, added that those efforts further highlight “the role of housing not just in community development but also in human development.”

Turning to current debates about the federal budget and other federal policies, Walsh said the Trump administration’s recent budget proposals and other federal initiatives are “an effort to end the system of federal partnerships that date to the New Deal and Great Society commitments of the 1930s [and] the 1960s.”  Left unchecked, he said, such policies would exacerbate the already significant problem of economic inequality in Boston.  Therefore, he added, he and other mayors are actively trying “to educate people on the impacts of inequality, and advocate for solutions” such as “health care; paid family leave and affordable daycare; strong labor laws and fair tax laws; financial regulation; [and] infrastructure investments.”

While these are daunting challenges, the mayor said, “I’m still counseling confidence” because the work the city has done and continues to do puts Boston “in a good position to respond to this moment. Even if the funding arrangements we’ve built seem threatened, the relationships we’ve built are strong. They will produce new solutions and new ideas. They will bring new partners to the table.”  Those partners, he concluded, hopefully will include the many graduate and undergraduate students who attended the lecture. “We are going to need you in the years ahead,” said the mayor.


Watch Mayor Marty Walsh deliver the 2017 Dunlop Lecture.

Thursday, March 2, 2017

Urbanization and Growth in India

by Sonali Mathur
Research Assistant
“Urbanization as a Growth Strategy for India” was the focus of a panel discussion on Saturday, February 6 at the India Conference at Harvard University, the largest student-run conference focusing on India held in the United States. (The Joint Center was one of the event’s co-sponsors.) As one of the most populous countries in the world, the policy decisions and investment choices that are made in India will have a resonance beyond its borders in terms of environmental impact and quality of life for one of the largest and fastest growing markets in the world. Panelists at the conference, who noted that India’s urban population is expected to grow significantly in coming decades, focused on a variety of topics including the role that urban areas can play in the country’s economy and the many challenges to achieving that goal.

Shirish Sankhe, Director of the Mumbai office of McKinsey & Co. opened by citing the 2010 McKinsey Global Institute report, India’s urban awakening: Building inclusive cities, sustaining economic growth, which estimates that India’s working age population will grow by nearly 270 million people by 2030 (from about 800 million to over 1 billion). The growth will be urban, he said, noting that by 2030 at least 10 of India’s 29 states will be more than 50 percent urbanized.  (Currently, only two relatively small states are urbanized.) Moreover, McKinsey projects a five-fold increase in GDP.

Accommodating this growth will be a major challenge, he conceded, because 25 percent of the urban population of India lives in slums and the country only invests $17 per capita per year in infrastructure, about an eighth of what McKinsey estimated was needed. Illustratively, because the country has underinvested in transportation, the share of people using public transportation is estimated to have dropped in recent years from 50 percent to 30 percent. Moreover, there is a significant lack of public understanding about administrative practices and the role of various organizations involved in city and state governance, which not only makes public participation challenging but complicates the entire planning process.

Photo courtesy of The India Conference

Prathima Manohar, an architect and founder of The Urban Vision, an urbanism “think do-tank;” asserted that another key challenge is that the leaders of India’s cities seem to be fixated on strategies that more developed parts of the world are moving away from, such as auto-centric development and over-consumption of resources. Despite the creative brilliance and skilled human capital in India’s cities, she added, there is a lack of civic and recreational space that would improve residents’ quality of life. However, she also said there are an increasing number of grassroots organizations working to improve urban environments. She also predicts that the success of these smaller enterprises will be paramount to improving livability of the cities.

Brotin Banerjee, CEO of Tata Housing, noted that the lack of affordable housing options is a problem that has plagued Indian cities for decades. Given the scale of the problem, he said it would take efforts from various sectors in order to make a difference. Tata Housing is spearheading this effort from the private sector, by investing in construction that provides homeownership options for the low- and middle-income urban residents. The challenge in doing this, he added, is devising models that are scalable and profitable, particularly when new projects must also provide supportive infrastructure such as water and sewer connections as well as roadways, which are typically the public sector’s responsibility.

Despite their diverse backgrounds, the panelists agreed that given the scale and interdependence of the urban problems in India, the prevalent expectation that the public sector should solve all the urban problems is unreasonable and likely detrimental. Instead, they agreed that there needs to be – and there seems to be – growing coordination between the public and private sector, and there is a significant role for grassroots organizations to play.

In discussions moderated by Bish Sanyal, Ford International Professor of Urban Development and Planning and Director of the Special Program in Urban and Regional Studies at MIT, the panelists highlighted a host of approaches and practices that, in their opinion, seem to be working. Shirish Sankhe noted that funding allocation methods based on competitive grounds, like the one being used for development of ‘smart cities,’ seems to be a successful model. These are small to medium size cities competing for federal fund to spur infrastructure development and the selection is based on certain predefined design criteria.

Along similar lines, he noted, there is a movement towards a performance management system of city governance. In this approach, India’s cities are ranked on various criteria which then puts pressure on the elected officials to perform and be more accountable to the public. Highlighting some of the positives surrounding the development of “greenfield” sites, he added that anticipation of transportation needs and how those are likely to evolve over time has become an integral part of planning. In the context of building more affordable housing, Brotin Banerjee noted that some of the policy solutions in recent times have revolved around making construction and green construction more cost effective by providing flexibility around height limitations and FAR regulations. He also added that perhaps the best form of public-private partnership would be talent sharing.

In response to questions from the audience about the segregation patterns that have or could emerge based on racial and cultural lines, the panelists agreed that Indian cities need to move away from identity based politics in order to avoid increased segregation and to build more inclusive cities.

Wednesday, February 22, 2017

What Can We Learn from Attempts to Reduce the Cost of Affordable Housing?

by Sam LaTronica
Gramlich Fellow
Midwestern CDCs trying to build affordable homes that do not require development subsidies have identified three potentially promising strategies: building smaller homes, utilizing factory-built homes, and creatively designing houses to get more out of them. In a new working paper that grows out my work as an Edward M. Gramlich Fellow in Community and Economic Development I conclude that while each technique presents opportunities for cost savings, each also comes with its own set of challenges.

The fellowship, which is co-sponsored by the Joint Center for Housing Studies and NeighborWorks® America, also expanded my horizons because for years, my conception of new “affordable housing” had been limited to the standard multifamily properties developed in larger urban areas. This was the type of affordable housing I had seen since moving to the Boston area, as well as working for an affordable advocacy organization in the San Francisco Bay Area prior to attending the Harvard Graduate School of Design.

As a Gramlich Fellow in the summer of 2015, I was exposed to a new region and new approach to affordable housing. The Midwestern CDCs, which were part of NeighborWorks® America’s national network, often had in-house general contractors and focused on building and selling affordable single-family homes, in both urban and rural areas. Given the dearth of housing subsidies, particularly subsidies for affordable housing in rural areas, these CDCs were trying to find cost-saving construction techniques that would allow them to build affordable housing without development subsidies.

The Rambler, a single-family home constructed by the Southwest Minnesota Housing Partnership. The home is 1,092 square feet on the main floor with another 1,092 square feet of unfinished basement space that can be converted into living space or more bedrooms at a later date. This home was constructed in 2014 with an asking price of $153,900.

Through reading popular literature on home construction, analyzing building trends, conducting interviews with CDC leaders, and visiting new developments in the Midwest, it became clear that CDCs were interested in pursuing three potential cost saving techniques: building smaller homes, using factory-built homes, and creatively designing houses to get more out of them.

Smaller homes are theoretically cheaper to build because they simply require fewer materials and less construction time. Once occupied, these houses not only can be cheaper to heat or cool but also will cost less to maintain. Smaller footprints also make it possible to build these homes on smaller or irregularly shaped lots, which helps expand the options for CDCs.

However, cost savings are not always realized when buildings are smaller. Once land and other development costs are factored in, it is possible that building smaller homes will be only slightly cheaper than building larger homes on the same lot. Moreover, the marginal cost of constructing a few hundred more square feet might allow the CDC to sell the house for more money while still keeping it affordable. Some CDC leaders also worry that producing affordable homes that are much smaller than new market-rate homes would create obvious distinctions between income levels and stigmatize the people living in the new, smaller homes. Finally, while building smaller can be smart for a number of reasons, most people still want bigger homes as evidenced by the fact that average house sizes have been increasing and have recently surpassed pre-recession levels. This suggests that without a shift in the overall market, smaller homes may not be a particularly appealing option for CDCs trying to build affordable housing.

While factory-built construction techniques are not necessarily new, they are new to many CDCs. Many Midwestern CDCs are currently experimenting with (or exploring the possibility of using) both modular homes and homes made from structural insulated panels (SIPs). Factory-built homes have the benefit of being produced mostly indoors and using assembly line techniques, which can significantly reduce onsite construction time and protect against weather delays, theft, vandalism, etc. Moreover, homes built in factory-controlled settings can be tighter and more energy efficient and make more efficient usage of building materials (which should reduce their cost).

Like building smaller, however, the cost savings that are touted in popular literature are harder to realize in practice. If CDCs, architects, contractors, and subcontractors do not have enough experience working with factory-built housing, then the development process can hit major roadblocks that negate the hypothetical cost savings that would result from a shorter construction period and lower production costs. In fact, some CDCs that experimented with these techniques ended up with homes that cost far more than they would have cost using traditional stick-built techniques.

Finally, creatively designing houses can supplement the previous construction types to get the most out of new homes. This can come in many forms. Designing attached accessory dwelling units will add more units to the housing stock and can supplement the primary tenant’s income.  Co-housing development can utilize scale and reduce the per-owner development costs. Open floor plans can make smaller homes more palatable and unfinished buildouts can reduce costs while allowing families to later customize their home to meet their particular needs.

In the end, there is no silver bullet that can be used to build affordable single-family homes without a development subsidy. However, there are many techniques that, when combined, could produce significant cost savings. CDC leaders interested in pursuing these approaches should remember that the benefits of these techniques, as described in popular literature, do not always materialize in practice. Therefore, CDC leaders should learn from others who have already experimented with them. They should also establish strong relationships with architects and contractors who have experience with these techniques, so that they reduce the likelihood of delays that would drive up costs. Hopefully, by persevering and learning from others, the CDCs can increase the production of affordable homes.

Sam LaTronica, who graduated from the Harvard Graduate School of Design in 2016, was a 2015 recipient of the TheEdward M. Gramlich Fellowship in Community and Economic Development, which is co-sponsored by NeighborWorks®America and the Joint Center for Housing Studies.

Tuesday, February 7, 2017

When Do Renters Behave Like Homeowners? High Rent, Price Anxiety, and NIMBYism

by Michael Hankinson
Meyer Fellow
In theory, renters and homeowners disagree about proposals to build new housing in their communities, particularly if that housing is close to where they live. However, in practice, this is not always the case. 

Rather, in a new Joint Center working paper that is based on new national-level experimental data and city-specific behavioral data, I find that in high-housing cost cities, renters and homeowners both oppose new residential developments proposed for their neighborhoods. However, in high-cost markets renters are still more likely than homeowners to support citywide increases in the supply of housing. Since changes in city governments over the past several decades have generally strengthened the power of neighborhood-level opponents to proposed projects, my findings help explain why it is so hard to build new housing in expensive cities even when there is citywide support for that housing.

NIMBYism and the Rising Cost of Housing

Since 1970, housing prices in the nation’s most expensive metropolitan areas have dramatically increased. Real prices have doubled in New York City and Los Angeles and nearly tripled in San Francisco. Driving this appreciation is an inability of new housing supply to keep up with demand. Even accounting for the cost of materials and natural geographic constraints on supply, the dominant factor behind this decoupling of supply and demand is political regulation, such as limits on the density of new housing developments and caps on the number of permits issued by a localities’ government.
                                               
These limits are a classic example of the NIMBY (Not in My BackYard) phenomenon. Even if residents support a citywide increase in the supply of housing, they may still oppose specific projects in their neighborhood. This seeming disconnect between views on citywide and local development policies creates a classic collective action problem for those policymakers who must find ways to reconcile the conflicting views.  

Photo by Michael Hogan/Flickr

Despite its popularity as a scapegoat, there is no individual-level, empirical data on how NIMBYism operates and among whom.
 Students of urban politics generally assume that homeowners have strong NIMBY tendencies not only because they benefit from rising house prices but also because they worry that nearby new housing units, particularly nearby subsidized housing units, might decrease the value of their home.

There is less consensus on (or studies of) how renters view new development. New supply may help ease prices for renters but their pro-development views may not be reflected in local policies because renters are less likely to become politically involved than highly motivated homeowners.  Alternatively, renters might not favor new projects if they believe the units will increase demand in their neighborhood, which, in turn, will lead to increased housing prices. To date, however, there has been very little research on how renters view development projects and whether their views differ from those of homeowners.
                                               
Measuring NIMBYism

To measure NIMBYism and general support for new housing, I collected two unique datasets. I conducted the first experimental tests of NIMBYism through an online survey of 3,019 respondents across 655 cities in 47 states. Respondents were asked about their support for development policies, including whether they would support a 10 percent increase in their city’s housing supply, with the question customized to each respondent’s city, stating how many homes and apartments currently exist and how many more would be built. Respondents also participated in an experiment where they were presented with two housing developments and asked which of the two proposals they preferred for their city. Each proposed development was described using several attributes, such as height and affordability level. To measure NIMBYism, respondents were also told how far each the of developments would be from their home, from two miles away to ⅛ mile away. By randomly varying this distance along with the other attributes, I was able to measure respondents’ sensitivity to proximity (NIMBYism), holding all other attributes equal.

To supplement this national survey, I also conducted a 1,660-person exit poll during the 2015 San Francisco election. Voters at 26 polling locations were asked their opinions on several housing-related ballot propositions similar to those presented in the national survey.

When Renters Behave Like Homeowners

As noted, renters and homeowners are expected to disagree on support for new housing, with NIMBY homeowners opposing citywide and neighborhood development and renters likely supporting the new supply. In line with existing theory, homeowners in my national survey largely opposed the proposed 10 percent increase in their city’s housing supply (28 percent approval), while a majority of renters supported the new supply (59 percent approval). Likewise, when asked in the experiment which of two randomly generated buildings they would prefer for their city, homeowners exhibited consistent NIMBYism, preferring buildings that were farther away from their home. In contrast, renters on average did not pick buildings based on distance from their home. If anything, renters preferred affordable housing that was closer to their home, displaying a YIMBY or ‘Yes in My BackYard’ attitude. In short, homeowners and renters tend to have very different attitudes towards both NIMBYism and the citywide housing supply.

However, in high-rent cities, renters look far more like homeowners. Instead of paying little attention to the location of proposed new housing, renters in expensive cities are just as NIMBY towards market-rate housing as homeowners. Moreover, this renter opposition to nearby development does not mean they support less new development overall. In fact, renters in expensive cities show just as much support for a 10 percent increase in their city’s housing supply as renters in more affordable cities. The main difference between these groups of renters is their NIMBYism.

Results from the San Francisco exit poll show a similar combination of supporting supply citywide, but opposing it locally. When asked about a 10 percent increase in the San Francisco housing supply, both renters and homeowners expressed high levels of support, at 84 percent and 73 percent approval, respectively. But, somewhat surprisingly, when asked if they would support a ban on market-rate development in their neighborhood, renters showed far more NIMBYism than homeowners, with 62 percent of renters supporting the NIMBY ban compared to 40 percent of homeowners.

NIMBYism and How We Permit Housing

Renters in high-rent cities generally both want new housing citywide but behave like homeowners when it comes to their own neighborhood. These scale-dependent preferences present a policy challenge for keeping cities affordable. Over the past 40 years, city governments have increasingly empowered neighborhoods to weigh-in on housing proposals through formal planning institutions. In doing so, these decisions have amplified NIMBYism and the ability to reject new housing, without maintaining a counterweight for the broader interest for new supply citywide. In other words, while most residents may support new housing for the city as a whole, both homeowners and renters are willing and increasingly able to block that supply in their own neighborhood, effectively constraining the housing supply citywide. This is housing’s collective action problem.

In separate research, I am empirically testing the effect of these strengthened neighborhood institutions on the rate of housing permitting since 1980. Likewise, I am conducting further experimental research on what types of citywide housing proposals are able to win the greatest support among both homeowners and renters. Hopefully, by measuring the tradeoffs between the ‘city’ and ‘neighborhood’ in the politics of housing, we can better address the deepening affordability crisis facing many American cities.

Thursday, January 19, 2017

New Benchmark Data Modestly Lowers Remodeling Market Size Projections

by Abbe Will
Research Analyst
The Joint Center’s Leading Indicator of Remodeling Activity (LIRA) provides a short-term outlook of national home improvement and repair spending to owner-occupied homes and is benchmarked to national spending estimates from the Department of Housing and Urban Development’s American Housing Survey (AHS). The latest LIRA release projects national spending for home remodeling and repairs will grow to $317 billion in 2017, an increase of 6.7 percent from last year. This LIRA release also updates and revises historical spending levels and growth due to the incorporation of newly released historical benchmark data from the 2015 AHS. Compared to last quarter’s LIRA release, the updated LIRA now shows lower and less cyclical growth in homeowner improvement and repair spending in 2014 and 2015, a somewhat lower market size estimate, and also more modest projections for remodeling market growth in 2017. According to Joint Center tabulations of the AHS, spending in 2014 and 2015 was not quite as robust as the LIRA model predicted, growing 11.3 percent from $250 billion in 2013 to $278 billion in 2015 compared to LIRA estimated growth of 14.3 percent over this time period. As seen in Figure 1, the lower growth in remodeling spending in 2014 and 2015 has implications for the size of the market projected by the LIRA model for 2016 and 2017.

Notes: Data for 2014 and 2015 are based on estimates from the 2015 American Housing Survey. Data since 2016 are modeled by the LIRA. Source: Joint Center for Housing Studies.

Previously, the LIRA estimated a homeowner improvement and repair market size of $305 billion in 2016 and projected spending growing to $326 billion by the third quarter of this year. Now with the replacement of AHS-based benchmark data for previously modeled benchmark estimates, the LIRA model indicates remodeling activity reached $297 billion in 2016 and projects spending will reach $317 billion this year. The implication of slightly slower growth in actual remodeling and repair spending is a reduction in market size projections for 2017 of 2.9 percent or $9.5 billion. Incidentally, the more modest growth projected by the LIRA for 2017 compared to the prior release is not related to the addition of the new historical benchmark data. The LIRA projections revise routinely as the year-over-year trends in the LIRA inputs are updated or revised.

The weighted average of the LIRA inputs produces the LIRA estimates and projections as seen in Figure 2A (for modeling improvements spending trends) and Figure 2B (for modeling maintenance and repair spending trends) compared to the now updated AHS-based benchmark data series for 1994-2015. The improvements LIRA continued to track the reference series very closely in 2014 and 2015. The estimates produced by the improvements LIRA model and the AHS-based benchmark now have a correlation coefficient of 0.84 (p-value of 0.00). And a simple regression of the LIRA output on the benchmark spending series results in an R-squared value of 0.6759, which suggests that upwards of 70% of the variation, or movement, in the improvements spending benchmark can be explained by the LIRA model.

Sources: JCHS calculations using HUD, American Housing Surveys; Department of Commerce, Retail Sales of Building Materials; and US Census Bureau, Construction Spending Value Put in Place (C-30); Leading Indicator of Remodeling Activity.

Similarly, Figure 2B compares the weighted average output of the maintenance and repair LIRA model to its AHS-based reference series. The maintenance LIRA has also tracked its benchmark fairly well since 2013. The maintenance and repair LIRA and its reference series have a correlation coefficient of 0.73 (p-value of 0.00) and a simple regression of the LIRA output on the benchmark results in an R-squared value of 0.5362, which suggests that about 54% of the movement in the home maintenance and repair spending benchmark can be explained by this LIRA model.

Sources: JCHS calculations using HUD, American Housing Surveys; Department of Commerce, Retail Sales of Building Materials; and US Census Bureau, Survey of Residential Alterations and Repairs (C-50); Leading Indicator of Remodeling Activity.

Last spring, the LIRA was re-benchmarked to a measure of home improvement and repair spending based on estimates from HUD’s biennial American Housing Survey, and at that time, historical remodeling and repair data from the AHS was available for 1994–2013. Until the 2015 AHS data became available, the LIRA model was used to estimate historical improvement and repair spending levels since 2013. Once every two years, with new historical AHS data, the LIRA benchmark series will be updated. With the January 2017 release, the LIRA model will be used to estimate historical spending levels since 2015 until the next biennial release of the American Housing Survey allows for actual 2016 and 2017 spending data to replace modeled estimates.

More information and analysis of recent and expected trends in home improvement and repair activity will be forthcoming in the Joint Center for Housing Studies’ latest biennial Improving America’s Housing report to be released on Tuesday, February 28th.

Tuesday, January 3, 2017

Projection: US Will Add 25 Million Households by 2035

by Dan McCue
Senior Research Associate
The United States will add 13.6 million households between 2015 and 2025 and another 11.5 million households between 2025 and 2035, according to Updated Household Projections, 2015-2035: Methodology and Results, a new Joint Center working paper. This growth represents an increase from the past decade that is in line with historic rates of growth seen in the 1990s, but still well below the levels experienced in the 1970s (Figure 1). An addendum to the paper indicates that the projected growth in households could lead to continued growth in residential construction activity.

 Click to enlarge
Sources: JCHS Tabulations of US Census Bureau, Housing Vacancy Surveys, Decennial Censuses, and 2016 JCHS Household Projections  

The new household projections incorporate newer population projections from the US Census Bureau that are substantially larger than the Bureau’s 2012 population projections used in our 2013 estimates of household growth, which projected that the U.S. would add 12.4 million households between 2015 and 2025 and 10.35 million households between 2025 and 2035. Our new household projections also make methodological changes related to headship rates—the ratio of households to people—designed to reflect the fact that shifts in headship rates have significantly impacted household growth over the past decade. (As the paper discusses in more detail, rather than continuing the Joint Center's recent practice of holding current headship rates constant, the new estimates use trended headship rates.)

While both changes are significant, the increases from our 2013 household projections are due entirely to the new Census Bureau population projections. In contrast, the methodological changes produce slightly lower projected growth than our previous methodology. However, the methodological changes do affect the distribution of household growth by age, race and ethnicity. In particular, they increase household growth among the oldest age groups and also among non-Hispanic whites between 2015 and 2025. In contrast, they reduce growth among 25-44 year olds as well as from black and Hispanic households.

Despite these shifts, millennials and minority households are still projected to be the main drivers of household growth in coming decades. Indeed, millennials under age of 30 in 2015 are projected to form 23 million net new households between 2015 and 2025, while 72 percent of household growth overall is expected to be non-white households. At the same time, aging of the baby boom generation will bring the number of senior households up to unprecedented heights (Figure 2). Together these forces will reshape housing demand over the next two decades.

 Click to enlarge
Source: 2016 JCHS Household Projections

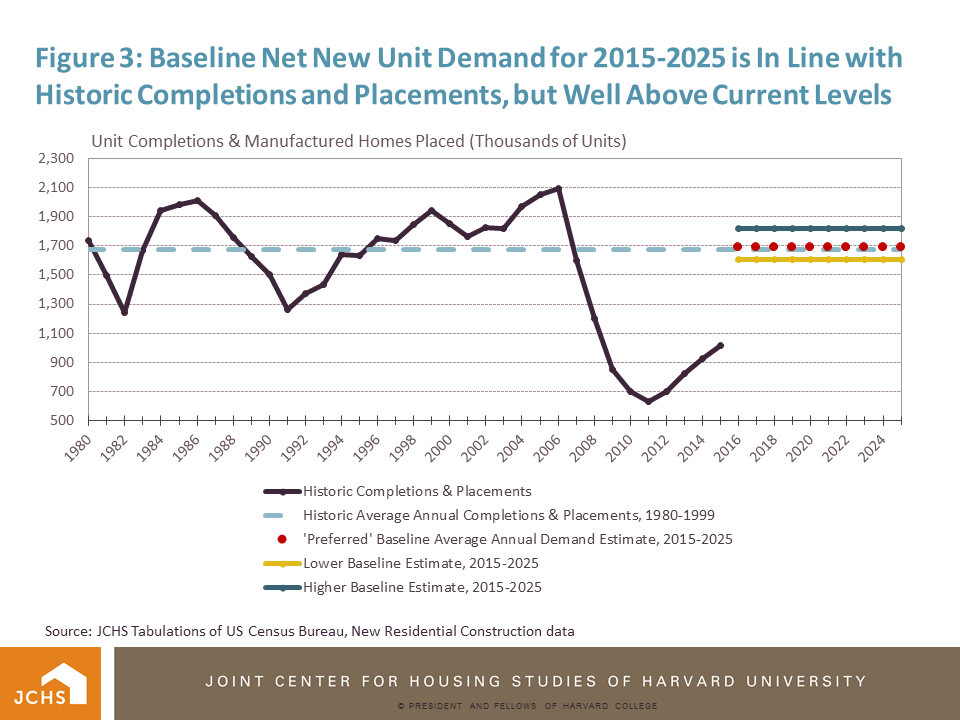
In addition to the estimates on household growth, the working paper includes an addendum with baseline estimates for the amount of new residential construction that might be needed to accommodate future household growth, as well as the demand for replacement units, second homes, and other changes. Combined, these factors suggest that the baseline demand for new housing units between 2015 and 2025 will range from 16.0 to 18.2 million units. While this estimate is well above most recent rates of new unit completions and mobile home placements, it is consistent with historic averages for past 10-year periods (Figure 3). Although the analysis does not factor in estimates of over- or under- supply, the estimates do suggest underlying demand will support higher construction levels and that the growth in residential construction seen over the past five years is likely to continue.

 Click to enlarge
Source: JCHS Tabulations of US Census Bureau, New Residential Construction data

Thursday, October 20, 2016

Growth in Remodeling Spending Projected to Peak in 2017

by Abbe Will
Research Analyst
Strong gains in home renovation and repair spending are expected to continue into next year before tapering, according to our latest Leading Indicator of Remodeling Activity (LIRA) released today. The LIRA projects that annual growth in home improvement and repair expenditures will continue to increase, surpassing eight percent by the second quarter of 2017 before moderating somewhat later in the year.

Homeowner remodeling activity continues to be encouraged by rising home values and tightening for-sale inventories in many markets across the country. Yet, a recent slowdown in the expansion of single family homebuilding and existing home sales could pull remodeling growth off its peak by the second half of 2017.

Even as remodeling growth trends back down, levels of spending are expected to reach new highs by the third quarter of next year. At $327 billion annually, the homeowner improvement and repair market will surpass its previous inflation-adjusted peak from 2006.


For more information about the LIRA, including how it is calculated, visit the JCHS website.

NOTE ON LIRA MODEL: As of April 21, 2016, the LIRA has undergone a major re-benchmarking and recalculation in order to better forecast a broader segment of the national residential remodeling market. For more information on this, see our earlier blog post, and read the research note: Re-Benchmarking the Leading Indicator of Remodeling Activity.

Thursday, July 21, 2016

Above-Average Gains in Home Renovation and Repair Spending Expected to Continue

Abbe Will
Research Analyst
Over the coming year, homeowner remodeling activity is projected to accelerate, keeping the rate of growth above its long-term trend, according to our latest Leading Indicator of Remodeling Activity. The LIRA anticipates growth in home improvement and repair expenditures will reach 8.0 percent by the start of 2017, well in excess of its 4.9 percent historical average.

A healthier housing market, with rising house prices and increased sales activity, should translate into bigger gains for remodeling this year and next. As more homeowners are enticed to list their properties, we can expect increased remodeling and repair in preparation for sales, coupled with spending by the new owners who are looking to customize their homes to fit their needs.

By the middle of next year, the national remodeling market should be very close to a full recovery from its worst downturn on record. Annual spending is set to reach $321 billion by then, which after adjusting for inflation is just shy of the previous peak set in 2006 before the housing crash.

 Click to enlarge

For more information about the LIRA, including how it is calculated, visit the JCHS website.

NOTE ON LIRA MODEL: As of April 21, 2016, the LIRA has undergone a major re-benchmarking and recalculation in order to better forecast a broader segment of the national residential remodeling market. For more information on this, see our earlier blog post, and read the research note: Re-Benchmarking the Leading Indicator of Remodeling Activity.

Tuesday, April 12, 2016

Three Things We Need To Do To Develop a Healthy Housing Stock

Mariel Wolfson
2012 Meyer Fellow
Our new working paper explores healthy home concerns and behaviors among American homeowners and renters. We show that both groups are interested in improving the indoor environmental health of their homes, but face myriad challenges to doing so. Below, we highlight three important steps we can take toward improving the health of our housing stock.

1. Demonstrate and Respond to Consumer Demand

Healthy housing is becoming more than a niche market. Nearly one in four households in our survey had some concern about health-related issues in their homes, and more than 20% acknowledged uncertainty about whether their homes might contain health risks. Nearly half of American homeowners responding to our survey have some level of interest in healthy home issues. In fact, 60% had already taken action – even if minor – to create a healthier indoor environment at home.


Notes: Sample size is 529.  Households that expressed some basic level of healthy housing concern were asked, "Which general category(ies) best describes your concern about the impact of your home on your household’s health? "Source: JCHS tabulations of Healthy Home Owner Survey, The Farnsworth Group.


The leading concern among respondents was indoor air quality (IAQ). As outlined in our paper, the most important action we can take to improve residential IAQ is to reduce indoor emissions, including the pollution that comes from heating and cooking, as well as from chemicals that are off-gassed by our furnishings, carpets, paint, and the materials used in constructing our homes. It is therefore critical that both consumers and building professionals have more options for non-toxic/less-toxic materials and products.

In a recent example, Home Depot and Lowe’s announced that they would stop selling flooring containing phthalates, a category of chemicals believed to disrupt human hormones. This “retailer gatekeeping” is one way to start shifting away from hazardous products and toward safer ones. As consumer demand grows and is recognized, forward-thinking manufacturers, retailers, and service providers who make healthy building a priority will be in a strong position to serve this market What’s good for health and the environment will also be good for business.


Notes: Sample size is 465. Households that expressed some basic interest in ‘invisible’ healthy housing issues were asked, “Among the healthy home issues that concern your household, please select up to three of them that generate the most concern."
Source: JCHS tabulations of Healthy Home Owner Survey, The Farnsworth Group.

2. Demystify the Problem

One encouraging conclusion of our working paper is that both homeowners and renters are interested in making their homes healthier, especially by improving indoor air quality and water quality. However, these same consumers report that information – including a lack of time to research options – is an obstacle to taking action. They are suspicious of spurious environmental and health claims (“greenwashing”) and aren’t sure where to turn for trustworthy, science-based information on healthy home products and services.

This problem is amplified when the potential project – remediation, remodel or replacement – is costly in terms of money, time, and energy. A homeowner concerned about potential mold or unhealthy insulation might be just as worried and confused about whether remediating the problem can guarantee a healthier home or improve symptoms such as asthma or allergies.

Another dimension of this problem is the sheer volume and complexity of scientific information on indoor air and environmental quality. Cutting-edge research – including such topics such as indoor microbiomes and chemical interactions with moisture and UV light – is truly fascinating. However, it is not actionable for the average consumer.

Moreover, as interesting as research on emerging issues is, it is important that we not lose sight of older yet persistent healthy housing concerns that have affected our housing stock for generations. In fact, the Lumber Liquidators disaster of 2015 was due to high levels of formaldehyde, one of the first three major indoor air pollutants that were identified back in the 1970s, along with radon and combustion pollution from heating and cooking. These are still serious healthy housing issues, as is lead paint. The Lawrence Berkeley National Laboratory has been a leader in indoor air quality research since the 1970s and offers a wealth of resources (designed for the public) on these issues.

Both our survey and the American Housing Survey show that numerous Americans still face basic structural integrity/safety problems in their homes, including insufficient insulation/weatherization, inadequate heating/cooling, electrical and plumbing problems, and pests. More attention to solving basic problems like these would go a long way toward making our housing stock healthier (for example, by helping to reduce the infiltration of outdoor air pollution, particularly in neighborhoods located near highways, airports, or industries.) While increased attention to chemicals and emerging issues is a positive development, we don’t want to neglect these critical basic issues.


Notes: Sample size is 414. Households that expressed some basic intention to act on specific healthy housing projects were asked, “Among the following healthy home actions your household has taken, plans to undertake or would like to undertake, please indicate how the related health issue(s) and/or risks(s) came to your household’s attention.”
Source: JCHS tabulations of Healthy Home Owner Survey, The Farnsworth Group.


3. Educate and Train Professionals on Solutions

Ever since the oil crisis of the 1970s, demand for energy-efficient homes has grown and building professionals have responded accordingly. Now, the construction/homebuilding/remodeling industry should do the same for healthy home concerns. As discussed in Point #1 above, consumers want their homes to contain fewer toxic materials and have good indoor environmental quality overall, but they need trustworthy expertise, services and information from the industry. Because energy efficiency and indoor environmental/air quality are so intertwined, this creates a natural opportunity for knowledgeable contractors to help their clients integrate both energy and IAQ concerns into upgrade/remodeling projects.

Building professionals who have relevant expertise – which includes knowledge of healthier/non-toxic materials and practices – will have a distinct competitive advantage both with individual homeowners and owners of multifamily buildings. Our paper shows that renters want healthier options, just as they want “green” units.

Fortunately, there is a growing number of initiatives that work to help building professionals develop this expertise, such as Healthy Housing Solutions, which offers training courses, as well as the National Center for Healthy Housing, the Healthy Building Network, the Perkins and Will Transparency project , and the Green and Healthy Homes Initiative. The Department of Housing and Urban Development’s strategy for action is another valuable resource.

Going forward, we hope that a focus on these three areas might go a long way towards improving the nation’s housing stock and the experience of the housing consumer, while also improving the nation’s overall health.

--
Read the full paper at Challenges and Opportunities in Creating Healthy Homes: Helping Consumers Make Informed Decisions by Mariel Wolfson and Elizabeth La Jeunesse