Showing posts with label baby boom. Show all posts

Thursday, March 9, 2017

The Continued Growth of Multigenerational Living

by Shannon Rieger
Research Assistant
A substantial number and share of older Americans are living in “multigenerational” households, according to our analysis of recently released 2015 American Community Survey (ACS) one-year population estimates. In total, 20.3 percent of all non-institutionalized adults aged 65 and over – about 9.4 million people – live in multigenerational households that include at least two generations of adults (individuals over the age of 25). The ACS data also show large differences in the prevalence and composition of multigenerational homes by age, race, and ethnicity.

The new data not only reflect the fact that there are a growing number of older Americans, but also that the share of older Americans living in multigenerational homes has been growing steadily since the 1980s. These trends are likely to continue as baby boomers age. Importantly, multigenerational living might allow some older Americans to enjoy a higher quality of life while aging in place, as an overwhelming majority of people want to do. At the same time, for some families of limited means, multigenerational living may be a financial necessity rather than a desirable living situation. Regardless of why they are choosing multigenerational living arrangements, providing families with education and support to suitably modify their homes could help these arrangements be as safe, effective, and beneficial as possible.

Who Lives in Multigenerational Homes?

About two-thirds of the 9.4 million older adults living in multigenerational homes live in households that have exactly two adult generations (usually parents and adult children aged 25 or older). The rest are in three-or-more-generation households that typically include grandparents, adult children, and grandchildren.

Trends in multigenerational living also change with age (Figure 1). The share of people living in multigenerational settings is highest for individuals in their late 20s (mostly due to adult children still living at home), then drops for those in their 30s as young adults move out and form their own households. The share rises again for people in their early 40s until peaking at about 23 percent for people in their late 50s. This “sandwich” age group includes people who are living with their adult children, those who are living with their aging parents, who often need daily support and care, and those living with both their children and aging parents.

https://blogger.googleusercontent.com/img/b/R29vZ2xl/AVvXsEhqj4k_iUYNU4umVzhUG0AFvy_Syt6KRx2nInEL_byZ7Ev5ZXYsyL1p00ao3UnwHEF4A2iq3vbaX8LOJGzyLcF9rbsdBC8nxP5IHZ51p8noyocXJzIjkpLgss19xCOltxNYiurAIWP0_di1/s1600/rieger_030917_figure1.png
Notes: Multigenerational households are those with least two adult generations aged 25 or older or that include grandchildren, adult children, and grandparents. Householders and parents are considered “adults” regardless of age. Other household members include extended family members (e.g. aunts, uncles, nieces, nephews) and unrelated individuals. Source: JCHS tabulations of US Census Bureau, 2015 American Community Survey 1-year Estimates. 

Because adult children move out and elderly parents pass away, the share of people living in multigenerational households declines for people who are in their 60s and early 70s. However, the share rises steadily for older adults in their mid-70s, who often are starting to face more daunting health and financial challenges. Among the oldest age groups (aged 85 and over), 27 percent – about 1.5 million people – lived in multigenerational households in 2015.

In addition to differences in age, people of color and foreign-born individuals are far more likely to live in multigenerational settings than non-Hispanic whites and people born in the United States (Figure 2). More than 25 percent of native-born blacks, Hispanics, and Asians/others aged 65 and over live in multigenerational homes, as do more than 45 percent of foreign-born in all three of these groups. In contrast, 15 percent of native-born non-Hispanic whites of the same age, and just over 20 percent of foreign-born non-Hispanic whites, live in multigenerational households. 

Notes: Whites, blacks, and Asians/others are non-Hispanic. Hispanics may be of any race. Multigenerational households are those with least two adult generations aged 25 or older or that include grandchildren, adult children, and grandparents. Householders and parents are considered “adults” regardless of age.
Source: JCHS tabulations of US Census Bureau, 2015 American Community Survey 1-year Estimates. 

A sizeable subset of these multigenerational homes include at least three generations: usually grandparents, adult children, and grandchildren living together under the same roof. Roughly ten percent of native-born blacks, Hispanics, and Asians/others aged 65 or over live in such households, along with around 25 percent of foreign-born older adults in each group. Among non-Hispanic whites, just under 4 percent of older native-born adults and 7 percent of the foreign-born live with three or more generations.

Looking forward, projected growth and demographic shifts in the older population seem likely to increase the number of multigenerational households and the share of people living in those households. The U.S. Census Bureau’s most recent population projections estimate that by 2035, about 79 million Americans will be age 65 or older, an increase of more than 30 million people in just two decades. This growth is due to the fact that the baby boom generation is getting older and because with increases in longevity more people will live well into their 80s, 90s, and beyond.  In fact, the Census Bureau projects the number of “oldest old” adults aged 85 and over to double over the next two decades.

The racial and ethnic composition of the older population will also shift markedly over the next several decades. The non-Hispanic white share of the 65-and-over population is projected to drop nearly ten percentage points to 69 percent by 2035, while the black, Hispanic, and Asian shares will rise, respectively, by 20 percent, 67 percent, and 39 percent (Figure 3). Census Bureau projections estimate that the foreign-born share of the 65 and over population will also continue to increase, growing from 13 percent in 2015 to 19 percent in 2035. Though the direction of future residential preferences among the older population is uncertain, the sheer magnitude of growth in the older population and the fact that much of the growth will be among the very old, people of color, and the foreign born suggests there will be substantial growth in multigenerational households in the coming years. 

Notes: Whites, blacks, and Asians/others are non-Hispanic. Hispanics may be of any race.   
Source: JCHS tabulations of US Census Bureau, 2014 Population Projections. 

Impacts on Housing and Services

As this growth occurs, it will be important to consider how new and existing housing stock might be designed or modified to best meet the needs of multigenerational households. Universal design features including single-floor living, zero-step entrances, and hallways and doorways wide enough to accommodate wheelchairs, walkers, or strollers can make homes more accessible for older adults with mobility limitations as well as for their young grandchildren. Flexible layouts that can change as family needs evolve, as well as the addition of semi-private spaces for each generation (such as in-law suites with separate entrances, multiple master bedrooms or kitchens, and accessory dwelling units), can also help make the housing stock better suited for multigenerational households.

While multigenerational living works well for many households, it is important to note that it is not necessarily a desirable option for every family. Rather, multigenerational living may be a financial necessity rather than an attractive housing option not only for families with lower incomes but also for moderate-income families living in higher-cost areas. Further, sharing a home with multiple generations can be challenging, particularly if the house is small, has inadequate amenities, or there are unclear or unrealistic expectations about responsibilities for both finances and personal care. Finally, informal help from family members may not be an adequate replacement for professional care, particularly for aging adults with serious health conditions. Providing families with guidance about how to live successfully in multigenerational settings, and, perhaps, with financial assistance to make home upgrades and modifications, will therefore be critical if multigenerational living is going to be an appealing, comfortable option for families of all means. While designing and carrying out such policies and programs will be challenging, such efforts have the potential to provide a more appealing and cost-effective housing option for older Americans and their families.

Tuesday, February 28, 2017

New Report: Aging Homeowners Drive Growth in Remodeling as Millennials Begin to Gain Footing

Homeowner spending on remodeling is expected to see healthy growth through 2025, according to Demographic Change and the Remodeling Outlook, the latest biennial report in our Improving America’s Housing series. Demographically based projections suggest that older owners will account for the majority of spending gains over the coming years as they adapt their homes to changing accessibility needs. Although slower to move into homeownership than previous generations, millennials are poised to enter the remodeling market in greater force, buying up older, more affordable homes in need of renovations.

The residential remodeling market includes spending on improvements and repairs by both homeowners and rental property owners, and reached an all-time high of $340 billion in 2015, surpassing the prior peak in 2007. [See our Interactive Infographic.] Spending by owners on improvements is expected to increase 2.0 percent per year on average through 2025 after adjusting for inflation, just below the pace of growth posted over the past two decades, and about on par with expected growth in the broader economy.

The large baby boom generation has led home improvement spending for the past twenty years, and its influence shows no signs of waning. Older homeowners will continue to dominate the remodeling market, as they make investments to age in place safely and comfortably. Expenditures by homeowners age 55 and over are expected to grow by nearly 33 percent by 2025, accounting for more than three-quarters of total gains over the decade. The share of market spending by homeowners age 55 and over is projected to reach 56 percent by 2025, up from only 31 percent in 2005.

Gen-Xers are now in their prime remodeling years, and while some are still recovering from home equity losses after the housing crash, many in this generation will undertake discretionary projects deferred during the downturn. And as younger households move into homeownership, they will supplement the already thriving improvement market.


Try the Interactive Infographic
“With national house prices rising sufficiently to help owners rebuild home equity lost during the downturn, and with both household incomes and existing home sales on the rise, we expect to see continued growth in the home improvement market,” says Kermit Baker, director of the Remodeling Futures Program at the Joint Center for Housing Studies.
Even though increasing house prices are encouraging homeowners to reinvest in their homes, they also are raising housing affordability concerns among younger buyers. Climbing mortgage interest rates and rising house prices not only make homeownership more difficult for younger households, but leave those who are able to buy with fewer resources to make improvements and repairs. And while high rents may provide an incentive to buy homes, they also make it difficult for first-time buyers to save for a downpayment.

Some demographic trends are also presenting challenges to a healthier remodeling market outlook. A disproportionate share of growth over the coming decade will be among older owners, minority owners, and households without young children; groups that traditionally spend less on home improvements.

“Despite these challenges, the remodeling industry should see numerous growth opportunities over the next decade,” says Chris Herbert, managing director of the Joint Center for Housing Studies. “Strong demand for rental housing has opened up that segment to a new wave of capital investment, and the shortage of affordable housing in much of the country makes the stock of older homes an attractive option for buyers willing to in invest in upgrades.”

Finally, as a new generation of homeowners enters the remodeling market, specialty niches focused on energy-efficiency, environmental sustainability, and healthy homes are likely to see significant growth. Home automation—encompassing everything from entertainment systems to home energy management, lighting, appliance control, and security—is also emerging as a strong growth market, particularly among younger households.

Looking ahead, there are several opportunities for further growth in the remodeling industry. The retiring baby boom generation is already boosting demand for accessibility improvements that will enable owners to remain safely in their homes as they age. Additionally, growing environmental awareness holds out promise that sustainable home improvements and energy-efficienct upgrades will continue to be among the fastest growing market segments.


Read the full report, try the Interactive Infographic, or join the conversation on Twitter with 
#HarvardRemodeling.

Thursday, February 16, 2017

Defining the Generations Redux

by George Masnick
Senior Research Fellow
How should we define the baby boom, Generation X, and the millennial generation?

In a Joint Center blog published in 2012, I argued that using 20-year age spans for each generation would make it easier to compare them. Since many researchers still use generational definitions that span different and inconsistent age ranges, particularly for millennials, it is perhaps timely to reframe and restate my case.

In keeping with my recommendations, the Joint Center has long identified the cohort born between 1945 and 1964 as baby boomers.Those born between 1965 and 1984 are Generation X, and the cohort born between 1985 and 2004 are millennials (Figure 1). 

However, other analysts use several different earlier dates to usher in the millennial generation, apparently because they want to ensure that the oldest member of this cohort were considered adults at the dawn of the new millennium (i.e. they had turned 18 or 20 in the year 2000). This definition meant that by 2015, the oldest millennials were in their mid-30s, old enough to prompt compelling stories about how many 30-somethings were still living with parents, living in cities, forsaking marriage and childbearing, and delaying homeownership. In contrast, under my recommended cut-off dates, the oldest millennials turned age 20 in 2005 and didn’t start entering their 30s until 2015.


Besides making it easier to compare generations, there are several reasons why the millennial generation should start with those born in 1985 and turning 20 in 2005. As I noted in my 2012 blog, 1985 was the year that U.S. births once again exceeded 3.7 million, the approximate number that demarcated the beginning and the end of the baby boom, as well as the beginning and the end of the “baby bust” that defines Generation X.

Three other big changes occurred shortly after 2005 that significantly altered the way young adults live. First, social media participation skyrocketed. Facebook became available to everyone age 13 and older with a valid e-mail address in September 2006. Twitter became public in 2006. The first iPhone was released in June of 2007. As a result of these and other changes, the share of adults using social media rose from five percent in 2005 to 69 percent in 2016, according to a recent Pew Research publication.

Second, student loan debt outstanding more than tripled between 2005 and 2016, rising from $400 billion to over $1.3 trillion. This high level of debt is thought to affect everything from leaving the parental home, to getting married and starting a family, and purchasing a first home. 

Third, and perhaps most importantly, the economic changes that led to the Great Recession hit hardest among young adults who were in their 20s shortly after 2005. The unemployment rate of adults older than 25 without a high school degree rose from below six percent in late 2006 to 15 percent in mid-2009. (Those with a high school degree or more followed this trend within a year.) Unemployment rates of those with a high school degree or more have slowly improved, but still remain above pre-recession levels. Unemployment rates for those with less than a high school degree have returned to their pre-recession elevated levels, but people in this group generally are making less money and receiving fewer benefits than they did before the recession. Meanwhile, housing costs have returned to, or now exceed, their pre-recession levels.

Using equally broad 20-year age spans produces several important findings about the different generations. To start with, the millennial generation has been larger than the baby boom generation, now or at any other previous time since the boomers were age 10-29 in 1975 (Figure 2). Millennials now number almost 87 million compared to less than 79 million for baby boomers at the same age. This is in contrast to findings of a 2016 Pew Research study that compared generations using millennials with a smaller age range and found roughly equal numbers between these two generations in 2015 (75 million).


Using consistent age spans also shows the changing ways that immigration has affected the number of people in each generation. In 1995, when Generation X was age 10-29, it was smaller than the baby boom generation was in 1955, when it was the same age. However, because of immigration, by 2005, when Generation X was age 20-39, it already exceeded the number of baby boomers at the same age. 

Immigrants also make up a small but growing share of millennials. In 2015, 9.6 percent of millennials were foreign born compared to 21.4 percent of Generation X, and 15.3 percent of baby boomers (Figure 3). However, according to the latest Census Bureau population projections, the share of millennials who are foreign born is expected to rise to 20.9 percent in 2035 when they are age 30-49, which will boost the number of millennials to 97.3 million (Figure 4).  


* Data do not allow 85-89 year olds from 85+ age group

Finally, the constant-age-span approach allows us to identify significant generational differences in race and ethnicity. Overall, in 2015, 45.4 percent of millennials, 41 percent of Generation X, and 28.6 percent of baby boomers were minorities (i.e. non-Hispanic Blacks, non-Hispanic Asian/Others, or Hispanics of any race). Moreover, because of continued immigration, the share of millennials who are minorities is projected to rise to almost 50 percent in 2035 and the share of Generation X is projected to rise slightly to 42.4 percent. In contrast, the share of baby boomers who are minorities is projected to hold constant at 28.6 percent. 

These differences reflect changes for both foreign-born and native-born members of each generation. In 2015, fully 85 percent of both foreign-born millennials and foreign-born members of Generation X were minorities.  In contrast, only 78.5 percent of foreign-born baby boomers were minorities. Moreover, while 41.2 percent of native-born millennials were minorities, only 29 percent of native-born members of Generation X and 19.6 percent of native-born baby boomers were minorities (Figure 5).

* Data do not allow 85-89 year olds from 85+ age group

Looking forward to 2035, the size of the baby boom cohort will drop to about 60 million people because a growing number of baby boomers will pass away. Many millennials and members of Generation X will want to live in the housing units formerly occupied by those baby boomers. Their ability to do so will not only be shaped by the fundamental economic and social changes discussed above but also by whether the large numbers of racial and ethnic minorities in these two generations will have full access to those housing markets, and with it, the ability to achieve the American dream. 

Tuesday, January 3, 2017

Projection: US Will Add 25 Million Households by 2035

by Dan McCue
Senior Research Associate
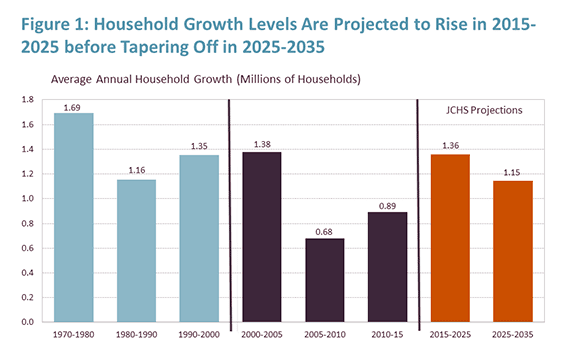
The United States will add 13.6 million households between 2015 and 2025 and another 11.5 million households between 2025 and 2035, according to Updated Household Projections, 2015-2035: Methodology and Results, a new Joint Center working paper. This growth represents an increase from the past decade that is in line with historic rates of growth seen in the 1990s, but still well below the levels experienced in the 1970s (Figure 1). An addendum to the paper indicates that the projected growth in households could lead to continued growth in residential construction activity.

 Click to enlarge
Sources: JCHS Tabulations of US Census Bureau, Housing Vacancy Surveys, Decennial Censuses, and 2016 JCHS Household Projections  

The new household projections incorporate newer population projections from the US Census Bureau that are substantially larger than the Bureau’s 2012 population projections used in our 2013 estimates of household growth, which projected that the U.S. would add 12.4 million households between 2015 and 2025 and 10.35 million households between 2025 and 2035. Our new household projections also make methodological changes related to headship rates—the ratio of households to people—designed to reflect the fact that shifts in headship rates have significantly impacted household growth over the past decade. (As the paper discusses in more detail, rather than continuing the Joint Center's recent practice of holding current headship rates constant, the new estimates use trended headship rates.)

While both changes are significant, the increases from our 2013 household projections are due entirely to the new Census Bureau population projections. In contrast, the methodological changes produce slightly lower projected growth than our previous methodology. However, the methodological changes do affect the distribution of household growth by age, race and ethnicity. In particular, they increase household growth among the oldest age groups and also among non-Hispanic whites between 2015 and 2025. In contrast, they reduce growth among 25-44 year olds as well as from black and Hispanic households.

Despite these shifts, millennials and minority households are still projected to be the main drivers of household growth in coming decades. Indeed, millennials under age of 30 in 2015 are projected to form 23 million net new households between 2015 and 2025, while 72 percent of household growth overall is expected to be non-white households. At the same time, aging of the baby boom generation will bring the number of senior households up to unprecedented heights (Figure 2). Together these forces will reshape housing demand over the next two decades.

 Click to enlarge
Source: 2016 JCHS Household Projections

In addition to the estimates on household growth, the working paper includes an addendum with baseline estimates for the amount of new residential construction that might be needed to accommodate future household growth, as well as the demand for replacement units, second homes, and other changes. Combined, these factors suggest that the baseline demand for new housing units between 2015 and 2025 will range from 16.0 to 18.2 million units. While this estimate is well above most recent rates of new unit completions and mobile home placements, it is consistent with historic averages for past 10-year periods (Figure 3). Although the analysis does not factor in estimates of over- or under- supply, the estimates do suggest underlying demand will support higher construction levels and that the growth in residential construction seen over the past five years is likely to continue.

 Click to enlarge
Source: JCHS Tabulations of US Census Bureau, New Residential Construction data

Tuesday, December 13, 2016

New Report: Number of Older Adults in the US Expected to Surge, Highlighting Need for Accessible Housing and Policy Improvements

Download the Report
By 2035, more than one in five people in the US will be aged 65 and older and one in three households will be headed by someone in that age group, according to our new report, Projections and Implications for Housing a Growing Population: Older Adults 2015-2035, released today. This growth will increase the demand for affordable, accessible housing that is well connected to services beyond what current supply can meet.

As the baby boom generation ages, the US population aged 65 and over is expected to grow from 48 million to 79 million, and the number of households headed by someone over 65 will increase by 66 percent, to nearly 50 million. This growth will increase the demand for housing units with universal design elements such as zero-step entrances, single-floor living, and wide halls and doorways.  However, only 3.5 percent of homes offer all three of these features.

“The housing implications of this surge in the older adult population are many,” says Chris Herbert, managing director of the Joint Center. “and call for innovative approaches to respond to growing need for housing that is affordable, accessible and linked to supportive services that will grow exponentially over the next two decades.”

In the coming years, many older adults will have the financial means to pay for appropriate housing and supportive services that allow them to live longer in their own homes. However, many others will face financial hardships, particularly because their incomes will decline in retirement. Low-income renters are particularly vulnerable, notes the report, which projects that nearly 6.4 million low-income renters will be paying more than 30 percent of their income for housing by 2035. The report adds that 11 million homeowners will be also be in this position by that time. In total, the report estimates, 8.6 million people will be paying more than half their income for housing by 2035. The report also projects that 7.6 million older adults will have incomes that would qualify them for federal rental subsidies by 2035, an increase of 90 percent from 2013. “Today, however, we only serve one-third of those who qualify for assistance,” says Jennifer Molinsky, a senior research associate at the Joint Center and lead author of the report. “Just continuing at this rate—which would be a stretch—would leave 4.9 million people to find affordable housing in the private market.”

The report notes that in many surveys, older adults express a strong desire to live at home for as long as possible. Achieving that goal will require public and private action to support modifications to existing homes, take steps to address the affordability challenges facing both owners and renters, and adapting the health care system to enhance service delivery in the home. There is also a need to expand the range of housing options available to better meet the needs of an aging population and improve options for older adults to remain in their community when their current home is no longer suitable. 

“The implications of our aging US population on the housing industry are unambiguous,” says Lisa Marsh Ryerson, President of AARP Foundation, which provided funding for the report. “It will be imperative, in the coming years, that the housing industry, policymakers, and individuals take action to address the need for housing that will enable millions of older adults in this country to live with security, dignity, and independence.”


Join the conversation on Twitter: #harvardhousingreport

Thursday, December 1, 2016

Have Recent Demographic Trends Contributed to the Rise and Fall of the Homeownership Rate?

by Jonathan Spader
Senior Research Associate
What has caused the ongoing, decade-long decline in homeownership in the United States? And which factors are most likely to influence homeownership rates in the future?

Discussions of the declining homeownership rate—which fell from 69 percent at its mid-2000s peak to below 64 percent in 2015—frequently point to demographic trends, such as delayed marriage and childbirth, an increasingly diverse U.S. population, and changing attitudes and preferences among both Millennials and retiring baby boomers, as the primary source of the decline. However, non-demographic factors like high foreclosure rates, tightening credit standards, and falling household incomes probably also contributed to the recent declines. To better understand the relative importance of the demographic changes, I used data from the Current Population Survey’s Annual Social and Economic Supplement (CPS/ASEC) for 1985-2015 to examine the extent to which changes in the distribution of U.S. households by age, race/ethnicity, and family type contributed to both the rise and fall in the homeownership rate over the past two decades.

I found that while there have been significant demographic changes in the last 30 years, these changes alone do not explain the last decade’s drop in homeownership rates. Nor do demographic trends explain why the homeownership rate rose from about 64 percent in 1990 to 69 percent in 2005. Rather, changes in the demographic profile of U.S. households suggest that the homeownership rate should have steadily declined by about 1-2 percentage points between 1985 and 2015. This, in turn, suggests that the rise and fall in the homeownership rate between 1985 and 2015 reflects changes in the broader economy, home price appreciation, mortgage credit conditions, and possibly household preferences for owning versus renting that alter the likelihood that demographically-similar households are homeowners.

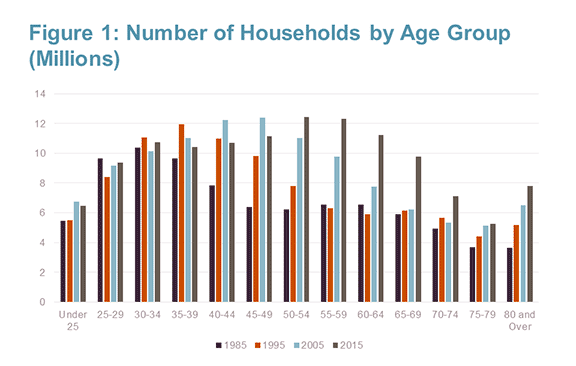
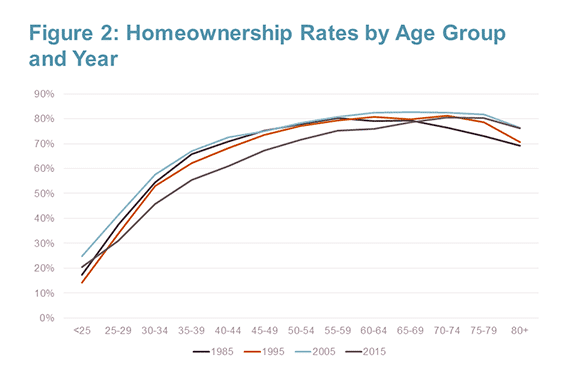
Several demographic trends are reshaping the profile of U.S. households. First, the aging of the baby boomer generation has increased the number of households in older age cohorts. For example, the number of households headed by an individual age 55-59 hovered near 6.5 million from 1985 to 1995 before increasing to 9.8 million in 2005 and 12.3 million in 2015. (Figure 1) This shift has put upward pressure on the homeownership rate by increasing the number of households in older age cohorts, which have higher homeownership rates than younger age cohorts. (Figure 2) In coming years, the baby boom generation will continue to reshape the profile of U.S. households as they reach the oldest age groups.

 Click to enlarge

 Click to enlarge

Second, the racial and ethnic makeup of U.S. households is changing. The share of white non-Hispanic households declined from 81.3 percent in 1985 to 67.6 percent in 2015. Over the same period, the share of black households increased from 10.8 percent to 12.5 percent, the share of Hispanic households more than doubled from 5.6 percent in 1985 to 13.0 percent in 2015, and the share of Asian and all other households more than tripled from 2.2 percent in 1985 to 6.8 percent in 2015. (Figure 3) The implications of these trends for the homeownership rate depend on whether historical differences in homeownership rates across groups will persist in coming years. Historical CPS data suggest that the Hispanic-White and Asian/Other-White gaps in homeownership rates narrowed only slightly between 1985 and 2015, whereas the Black-White gap increased from 24.6 percentage points in 1985 to 28.8 percentage points in 2015. (Figure 4)

 Click to enlarge

 Click to enlarge

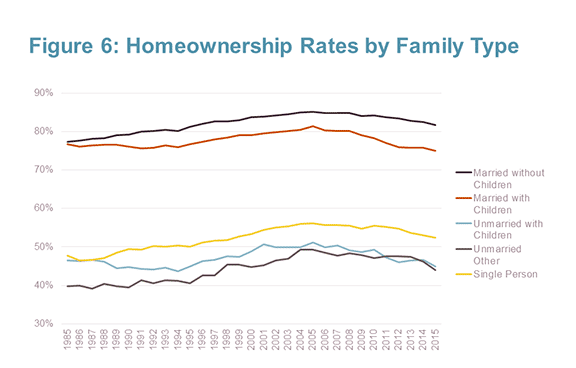
Third, larger numbers of young households are delaying marriage and childbirth until later in life, or forgoing them entirely. The share of households headed by a married couple decreased steadily from 58.9 percent in 1985 to 49.9 percent in 2015. The reduction is due entirely to decreases in the share of married couples with children, as the share of married couples without children remained approximately constant during this period. The decline is offset by increases in the share of single person households, unmarried households with children, and other unmarried households. (Figure 5) While homeownership rates for all groups have declined in recent years, the rates are consistently highest for married couples with children. (Figure 6)

 Click to enlarge

 Click to enlarge

To estimate the cumulative effect of these trends, I conducted shift-share analyses using the CPS/ASEC data. These analyses hold constant homeownership rates at their levels in various years to reveal the extent to which changes in the homeownership rate are driven by changes in the number of households in each age, race/ethnicity, and family type group. For example, using the 1985 sample, I calculated the 1985 homeownership rates associated with each combination of the 13 age groups, 4 racial/ethnic groups, and 5 family type groups shown in the figures above—creating 260 categories in total. For each of the years from 1986-2015, we can then calculate what the U.S. homeownership rate would have been if the homeownership rates for each group remained at the 1985 level. (Readers seeking a more detailed description of the methodology for this analysis can consult a forthcoming JCHS working paper.)

Figure 7 displays the results of such calculations when rates are held constant at their levels in 1985, 1990, 1995, 2000, 2005, 2010, and 2015. The projected homeownership rates suggest that changes in the profile of U.S. households by age, race/ethnicity, and family type do not explain the boom and bust trends in homeownership rates since the early 1990s. Rather, these factors predicted a modest decline in the homeownership rate of about 1-2 percentage points between 1995 and 2015. However, the overall predicted homeownership level varies sharply across the various years, which is the result of unmeasured changes across time in the broader economy, home price appreciation, mortgage credit conditions, and possibly household preferences for owning versus renting that alter the likelihood that demographically-similar households were homeowners in different years.

 Click to enlarge

For a second analysis, I added additional variables to the shift-share analysis using a regression model to calculate the homeownership rates associated with each variable. (Again, more detail about the methodology can be found in the forthcoming working paper.) Specifically, the second analysis adds information on household income, employment status of the head and spouse, educational achievement, veteran status, and more detailed measures of marital status and the presence of children in the household. The projected homeownership rates from this analysis show that while these factors produce more volatile projections, they explain very little of the rise and fall in the actual homeownership rate between 1985 and 2015. The one possible exception is the period from 1996 to 2000, when rising incomes and employment help to explain a portion of the rise in the homeownership rate at that time. However, these factors are not able to explain the continued rise of the homeownership rate following the 2001 recession or the subsequent bust in the latter part of the decade. (Figure 8)

 Click to enlarge

Taken together, these findings suggest that demographic factors explain very little of the rise and fall in the homeownership rate from 1985-2015. Rather, changes in the profile of U.S. households during this period have placed competing pressures on the homeownership rate and largely offset one another. Looking forward, the aging of the baby boom generation and the coming of age of the Millennial generation are similarly unlikely to substantially alter the homeownership rate in the near future. Instead, the trajectory of the homeownership rate depends more heavily on how quickly the foreclosure backlog clears, how many people who lost their homes to foreclosure buy homes in the future, how long mortgage credit conditions remain tight, and whether young households’ slowed rates of homeownership entry persist in future years. Additionally, any major changes in the broader economy, housing finance system, or attitudes toward homeownership may also influence future homeownership rates to the extent that they alter households’ demand or access to homeownership.

Monday, September 12, 2016

As Baby Boomers Age, Older Single Women Will Face the Greatest Housing Challenges

Shannon Rieger
Research Assistant
While high-quality, age-friendly, affordable housing will be a critical need for all of America’s growing number of aging households, for two reasons, the needs of older single women require particular attention for policymakers, providers, and others.

First, because women generally outlive their male spouses or partners, they will continue to be a major share of all older households. Women living alone already comprise 44 percent of all households (and three-quarters of all single-person households) where the householder is age 80 or over (Figure 1). Such women—particularly women who rent rather than own their homes—are among those older people who are most at risk of housing, financial, and health insecurity as they age.

 Click to enlarge
Source: JCHS tabulations of 2014 American Community Survey data.

These challenges are one aspect of a larger demographic transformation that will occur over the next several decades as the aging of the baby boomer generation and increases in longevity swell the elderly American population. The US Census Bureau projects that the population aged 65 and over will reach 79 million by 2035, an increase of more than 30 million in just two decades (Figure 2). Further, longer life expectancy could nearly double the number of individuals aged 85 and over to 12 million by 2035.

 Click to enlarge
Source: US Census Bureau 2015 Population Estimates and 2014 National Population Projections.

This so-called “Silver Tsunami” has already begun to reshape housing needs across the nation, generating demand for accessible, affordable housing that can help older households age safely and comfortably in place. As people age, finding the resources to make age-friendly home modifications, to pay for assistance with daily activities and self-care, or even keep up with housing payments often becomes increasingly difficult. The risk of falling into financial and housing insecurity grows when households cross into their retirement years (age 65), as incomes begin to drop dramatically while out-of-pocket health care expenditures rise (Figure 3). While some households may be able to adequately supplement shrinking incomes with retirement savings, home equity, and other forms of wealth, a recent report from the Employee Benefit Research Institute shows that many households on the verge of retirement today have insufficient savings to independently finance their retirement years.

 Click to enlarge
Source: Median household income derived from JCHS analysis of 2014 American Community Survey Data. Out-of-pocket personal health care spending data derived from the Centers for Medicare and Medicaid Services’ National Health Expenditure Data, 2012 Age and Gender Tables.

Some aging households are particularly vulnerable to the consequences of financial insecurity and loss of independence. Older individuals who live by themselves, for example, often have neither the option to seek help with daily activities or unexpected emergencies from another person in the home, nor the financial cushion of a second income from a spouse or housemate. Women are disproportionately impacted. Older women, who are more likely to live alone in later life, continue to have lower lifetime earnings than their male peers, and are also more likely than men to need expensive long-term care. As a result, single women are projected to experience the largest retirement savings shortfalls over the next several decades.

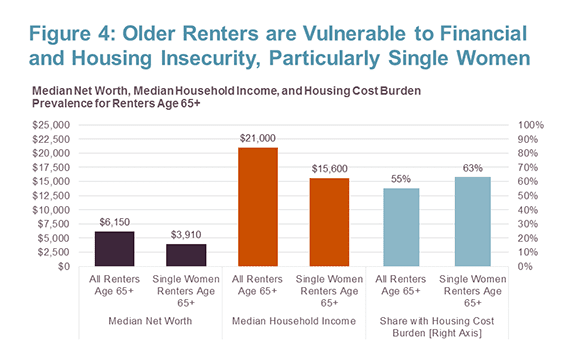
Single older women who rent rather than own their homes are most at risk of falling into housing and financial insecurity. Older renters lack housing equity and typically also have far lower overall net worth than older owners, leaving many unable to sufficiently bolster limited retirement incomes with financial reserves. Analysis of the most recent Survey of Consumer Finances data shows median net worth for renters age 65 and over to be just $6,150—a mere 2.4 percent of median net worth for owners of the same age. For single older women renters, median net worth is even lower—just $3,910—and the risk of financial insecurity is especially high, intensified by comparatively lower incomes and even higher housing cost burdens than older renters overall (Figure 4). In 2014, annual median income for single women renters age 65+ was just $15,600. Meanwhile, fully 63 percent had a housing cost burden, with 38 percent paying at least 50 percent of their income toward housing. This combination of high housing cost burdens, low incomes, and little net wealth mean that older single women renters have few resources left to pay for assistance with self-care and other needs. But with median annual costs for non-residential long-term care ranging from $17,680 for adult day health care to $45,760 for full-time homemaker services, formal care is far out of reach for many single older women. With the aging of the baby boomer generation poised to increase the number of single older women living alone to unprecedented proportions over the next several decades, finding ways to mitigate housing and financial instability among this most vulnerable group is fast becoming a critical need.

 Click to enlarge
Source: JCHS tabulations of 2013 Survey of Consumer Finances (SCF) and 2014 American Community Survey (ACS) data. Dollars are nominal.
Notes: "Moderate" burden is defined as housing costs of 30-50 percent of income. "Severe" burden is defined as housing costs of more than 50 percent of income. Due to survey design differences between SCF and ACS, "single women renters" refers to single-person female-headed households for data describing median household income and housing cost burdens, and to women whose marital status is "single" for data describing median net worth.

As previous Joint Center work has highlighted, our aging population will re-shape housing demand across the nation over the next several decades, greatly increasing the need for affordable, accessible, age-friendly housing. Ensuring that older single women, especially renters, have access to high-quality housing and home care will require particular attention, given their low incomes, low wealth, high likelihood of need for care, and the absence of a spouse, partner, or other household member able to provide daily assistance in the home. As the older population grows in coming years, it will be critical for policymakers and providers to take special care to ensure that our nation’s most vulnerable older households—particularly older single women—have access to tools that can help them age safely and successfully in their own homes and communities. Such tools may include affordable rental options and in-home care and homemaking services, as well as loan and grant assistance opportunities for age-friendly home modifications. Finding ways to expand access to these and other solutions will be critical to protecting the health, happiness, and well-being of our aging population today and in years to come.

Friday, March 18, 2016

Millennial Housing Issues in Perspective: Visualizing Cohort Trends in Population Size, Household Numbers, Ownership and Renting

George Masnick
Senior Research Fellow
Today’s 41 million young adults age 25-34 have been slow to move into independent household formation and homeownership. Exactly how slowly and why, and what the future likely holds for these individuals over the next decade, is the subject of much debate. The magnitude of delayed household formation and homeownership can perhaps be better appreciated if we directly compare this young cohort of adults with the cohorts that preceded them in the age structure. The four figures below track the different cohorts’ trends between 2003 and 2013 in population size, total households, owner households and renter households as measured by the American Housing Survey.

Population Size

Figure 1 shows population size of five different 10-year birth cohorts. The youngest cohort (born 1979-1988) remained fairly constant in size between 2003 and 2013 at about 41 million. This number is slightly larger than the next oldest cohort (born 1969-1978), but not as big as the cohort born 1959-1968, which includes younger baby boomers.


The cohorts born from 1959-1968 and 1969-1978 increased slightly in size over the 2003-2013 period due to migration from abroad, underscoring the fact that cohort size among young and middle-age adults can still grow as we go forward. Why the 1979-1988 birth cohort did not also increase in size between 2003 and 2013 (it actually declined by about 300,000) is likely due to the effects of the Great Recession having had a bigger impact on 25-34 year-old immigration. The growth in the total number of annual undocumented immigrants actually turned negative during this period, and slow job growth in construction and manufacturing also had a large impact on slowing overall immigration into the under 35 age groups.

U.S. immigration law still promotes family re-unification as one of its core principles, and this provision was less impacted by the economic downturn than employment driven immigration, and probably resulted in a more sustained immigration of 35-44 and 45-54 year olds. In addition, undocumented immigrants in these age groups were more likely to have lived here longer and have children born in the U.S., so they were less likely to have left the country during the Great Recession.

From 2003-2013, the two oldest cohorts between age 55-64 and 65-74 lost population due to mortality. The oldest (born 1939-1948) declined by 22 percent and the next oldest (born 1949-1958) lost 11 percent of its population.

Number of Households

Figure 2 shows parallel cohort trends in the number of households produced by the population in Figure 1. Three things are noteworthy. First, most of a cohort’s contribution to household growth occurs as it moves from age group 15-24 to 25-34, as is visible in the sharp upturn in households among the leftmost (youngest) cohort in Figure 2. Second, the cohort born 1969-1978 (red line) appears to have formed fewer households in 2013 at age 35-44 relative to older baby boomers at the same age than its population size might have predicted. The 1969-1978 cohort is not on track to attain the household numbers achieved by the 1959-1968 and 1949-1958 cohorts (green and purple lines). Third, the two oldest cohorts, although having lost a significant share of their populations from mortality, did not reduce their household numbers proportionally.

Lower levels of household formation in the youngest two cohorts when compared to baby boomers are somewhat expected because they contain higher shares of both foreign born and minority native born, each of which have lower rates of forming independent households. They are also cohorts that have experienced delayed marriage and fertility among the native-born non-minority population, making independent household formation for the youngest members of the cohort as a whole even less likely. But if members of these cohorts are simply postponing marriage and family formation, household formation for many is also being postponed, so future upward movement in household trajectories when cohorts are still under age 45 is likely.

The fact that household numbers after age 55 do not drop as quickly as population numbers is because married couples head most households in older age groups, and if one spouse dies, the household generally survives. In addition, divorce in middle and old age generally turns one household into two, partly offsetting deaths that occur to persons who live alone. After age 75, losses from mortality increase dramatically, so it will not be until after 2020 for the oldest baby boomers, and after 2030 for the youngest and largest baby boomer cohort that significant declines in older owner households take place.

Owner and Renter Household Trends

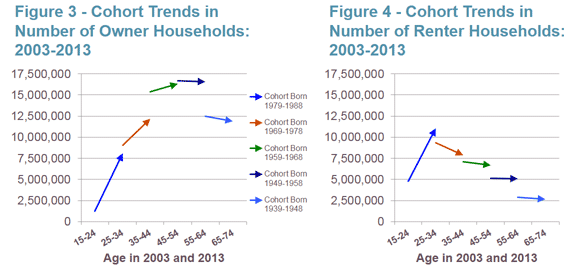
Decomposing the cohort trends in total household numbers into owners and renters further refines our understanding of the demographic underpinnings of recent household and housing market dynamics. The youngest cohort’s shortfall in household formation, as it moved into the 25-34 age group, was especially severe on the owner side, as shown in Figure 3.


In spite of having a noticeably larger population at age 25-34 compared to the next oldest cohort (red line), and a slightly larger number of total households at the same age, owner households were almost a million fewer. In addition, this next oldest cohort also shows levels of owner household formation well below what was achieved by the cohort born 1959-1968 (green line) when it was age 35-44 in 2003. Finally, the 1959-1968 cohort had slightly fewer owners in 2013 than the next oldest cohort (purple line) at age 45-54 despite having both 4+ million more people and 1.2 million more total households. But we must not lose sight of the fact that the older 1959-1968 and 1949-1958 cohorts aged into their 40s and 50s during a very different economic period (1993-2003) with better income growth, looser mortgage lending standards and more affordable newly built housing. The number of owner households that these older cohorts achieved at ages 25-34, 35-44, and 45-54 might not be a proper benchmark by which to judge the progress of today’s younger cohorts.

Figure 4 shows that in 2013, the number of renters in the youngest cohort at age 25-34 was significantly larger than the number of owners (11 million compared to 8 million). This compares to much greater parity between the number of owners and renters in the next oldest cohort when it was age 25-34. Although the number of owners in the youngest cohort was well below the number of renters in 2013, the increase in owners between 2003 and 2013 was still larger than the increase in renters.

Looking forward, the 1979-1988 cohort is going to add many more owners over the next 10 years, while at the same time its number of renters should decline when the cohort moves between ages 25-34 and 35-44, given historical cohort transitions. In fact, this youngest cohort should continue to add owners and lose renters over the next three decades until it reaches ages 55-64. Of course, the exact numbers of owner additions will be determined by the state of the economy, by income trends, by housing prices and mortgage interest rates, and by lending practices of banks and mortgage companies. To a certain extent, future homeowner numbers will also be determined by future demographic trends in marriage, fertility, immigration and mortality that affect this age group, but these are less likely to involve significant departures from recent historical levels and are more predictable.

By examining the cohort trends in the numbers of population, households, owners and renters in the way we have, we gain a greater appreciation of the degree to which millennials have been slow to form owner households. But we also find that the next older cohort, born 1969-1978, is also well below levels achieved by baby boomers when they were the same ages. There remains room for much upward movement in owner household formation for these two youngest cohorts. However, it is unlikely that these cohorts will ever reach the 16 million owner households achieved by each 10-year baby boomer cohort without significant reductions in the obstacles they now face in becoming and remaining homeowners. Still, we should look forward to continued gains in owner household formation for the two youngest cohorts as they move into their 40s and 50s over the next decade and beyond.

Tuesday, December 15, 2015

Look Who’s Renting: The People Behind the Recent Surge in Demand for Rental Housing

Dan McCue
Senior Research
Associate 
One of the major trends highlighted in the Joint Center’s recently released report America’s Rental Housing 2015 is the unprecedented growth in the number of renter households over the past 10 years.  The numbers are dramatic no matter how you slice them, leading to an impressive list of facts: we’ve been adding nearly a million renter households a year for almost a decade; the number of renters has grown by fully 25 percent in the past 10 years; there are nearly 9 million more renter households in 2015 than there were in 2005; and in the past ten years we have seen the largest increase in renters of any 10-year period in history on records dating back to the 1960s. This sharp growth in demand has been the primary force behind the widespread tightness in rental markets that has driven vacancies down and rents up for millions of Americans as supply works to respond.  And supply is responding with more multifamily construction currently under way than in any time in the past 30 years.

 Click to enlarge

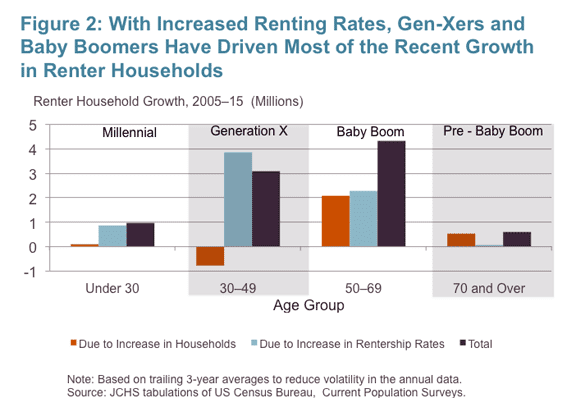
So who are all the renters behind this recent growth?  The answer may be somewhat surprising, particularly in terms of the age breakdown.  One might imagine that since renters tend to be younger (with a median age of 40 years versus 55 for homeowners), the majority of recent growth would have been from millions of young millennials piling into rentals in high numbers.  It turns out, however that while the millennial generation (born 1985-2004) is indeed the largest in history in terms of population, they are only responsible for a relatively small portion of the growth in rental population over the last 10 years, approximately 11 percent.  In contrast, well over half of the growth in renters (55 percent) – fully 4 million households– was from people aged 50 and over.  Generation-X-ers (born 1965-1984) in the 30-49 year old age group were responsible for 34 percent of all renter household growth since 2005.

As shown by figure 2, much of the growth in the number of renters age 50 and over reflects a boost in population due to the baby boom generation, who are currently age 50-69 and now entirely in this 50+ age group.   However, only about half of the growth in renters over age 50 resulted from population growth.  The other half of growth was due to householders being more likely to rent than in past years.

 Click to enlarge

Figure 2 also shows how the increased rate of renting among gen-Xers was the entire source of growth in the number of renters aged 30-49 year old.  That the number of renters in this age group grew at all over the past 10 years was impressive given that the total number of households in that age group (owners and renters combined) actually declined during this period.  Indeed, at a stage of life where first time homebuying typically occurs, rentership rates for this generation have not fallen off with age like those of previous generations.  Renters are sitting tight, moving less, and making fewer units available for Millenials to enter the rental market. 

In addition to the age breakdown, the incomes of new renter households may also be surprising.  Again, while renters as a group still tend to have lower incomes relative to owners (median income of $34,000 versus $65,000 for owners), the fastest rates of growth over the past ten years has been in high-income renters (Figure 3).  The number of renters in the top 10 percent highest income bracket grew by 61 percent, more than double the pace of overall growth in renters.

 Click to enlarge

Growth in renter households has extended beyond single-person and unrelated roommate households to encompass all types of living arrangements, including those more commonly associated with homeownership (Figure 4).  Families with children made up a quarter of all growth in renters in 2005-2015, roughly evenly split between couples and single parents.

 Click to enlarge
Additionally, with the resurgence in the number of white, non-Hispanic renter households (who made up one-third of renter household growth in 2005-2015), renter growth was split more evenly across races and ethnicities than in the 1990s and early 2000s when the number of white renters was on the decline.  But minority households continued to be a large part of renter growth, as have immigrant households, with foreign-born renters making up fully 26 percent of growth, even with the post-recession slowdown in immigration.

 Click to enlarge

In sum, the wide-ranging surge in rental demand underscores the fact that rental housing remains an important and necessary housing option for people of all races, incomes, and living arrangements, and one that is becoming an increasingly popular housing choice at all stages of life.  The diversity of the population demanding rentals also necessitates a broad range of rental housing options—with an array of types, styles, sizes, amenities, rent levels, and locations—to meet the needs of renters today and in the future.


Friday, September 18, 2015

Where Are All the Homes? Demographic Underpinnings of the Lack of For-Sale Inventory

by Dan McCue
Senior Research Associate
One of the challenges faced by housing markets has been a persistent lack of inventory of homes for-sale. Indeed, the most recent data on existing home sales from the National Association of Realtors® show that for 37 months we’ve been in a seller’s market – traditionally defined as a market in which there is less than six months’ supply of homes listed for sale (Figure 1). And, according to Redfin, this year’s spring buying season saw inventory nationwide hit record lows (see June Housing Markets Sets All-Time Records for High Speed and Low Supply).  In the many markets with few homes available for sale, new listings are almost immediately snatched up, with the high competition among buyers pushing prices out of reach of a growing number of would-be homeowners.    

Note: Data include existing single-family, condo, and co-op units for sale. Annual data are seasonally adjusted monthly averages. 2015 data are year-to-date through July. Source: National Association of Realtors®, Existing Home Sales via Moody’s Analytics.

There are several possible explanations commonly mentioned as to why for-sale inventories remain so tight, including the large number of owners stuck in homes because they are ‘underwater’ on their mortgages, the still-elevated volume of homes in the foreclosure process and held off the market, the lack of new construction in the years following the housing boom, and the many single-family units that have been taken out of the for-sale market to become rentals. But one additional reason not often discussed is demographics, which has also been playing a role in both the lack of inventory and in the slowness in new home sales over the past several years. Indeed, the ongoing generational shift among American households has slowed sales in the short run and is likely to continue to dampen sales over the next two decades.

Demographics and the Reduced Pool of Active Trade-up Homeowners

Over the past ten years, members of generation-X aged into the 30- and 40- year old age groups (Figure 2). As this relatively small generation, once called the baby-bust, replaced the large baby-boom generation now in their 50s and 60s, the population in their 30s and 40s declined. In some cases, the declines were stark. For instance, for the 35-39 year old age group, the population in 2013 was 9.3 percent smaller than it was 10 years earlier, with 10.4 percent fewer households.

Source: JCHS tabulations of US Census Bureau, Population Projections.

At the same time, as the 2015 State of the Nation’s Housing report mentions, the US homeownership rate took a significant dive, dropping to levels not seen in 20 years, with outsized declines among some age groups and the sharpest drop occurring among 35-44 year olds. Indeed, despite all the attention given millennials, homeownership rates among gen-Xers – particularly those currently age 35-44 – are actually furthest below 20-year historical rates of similarly aged adults (Figure 3).

Source: JCHS tabulations of US Census Bureau, Housing Vacancy Surveys.

So in combination, the demographically-driven decline in population of 30- and 40 year-olds was magnified by a sharp drop in homeownership rates, resulting in a significant decline in the number of homeowner households at these ages. Among the 35-39 year old age group, for instance, the number of homeowner households dropped fully 23 percent between 2003 and 13, and among 40-44 year-olds the decline was a substantial 19 percent (Figure 4)

Source: JCHS tabulations of US Census Bureau, Current Population Surveys.

Traditionally, the 30s and 40s are key ages for housing market activity – particularly for trade-up and new home purchases. Indeed, homeowners aged 35-44 historically make up the majority of trade-up buyers (Figure 5). Fewer current homeowners in this key age group has meant fewer potential trade-up buyers and sellers, meaning fewer people putting their homes on the market, adding to tight inventories of for-sale homes. 

Source: JCHS Tabulations of American Housing Survey data.


Source: JCHS Tabulations of American Housing Survey data. 

Additionally, one of the most common ownership opportunities desired by trade-up buyers is a new home. Indeed, 35-44 year olds are also typically responsible for a high share of new home sales (Figure 6). And the majority of new homes sales to this age group are to those who are currently homeowners, so fewer current owners in this age group has also meant fewer potential buyers of new homes, fewer new home sales, and therefore a sizeable headwind to single family homebuilding. And there are other implications as well, such as for home improvements spending, given that most movers do some kind of post-move improvements, even if it’s just painting the walls, so fewer sales among gen-X has also affected remodeling spending markets as well.

Source: JCHS Tabulations of American Housing Survey data. 

While the millennials and baby boomers attract most of the headlines about how demographic trends are influencing housing demand, gen-X ers may actually be more influential than they get credit for in contributing to the recent weakness in single-family construction, home re-sales activity, and the widespread lack of inventory in many markets. 

One final note, however, is that the aging of the baby boom generation may also be contributing to the low levels of inventory and slower home sales – and this contribution may be a longer-lasting trend than that of the gen-X discussed above. Since mobility rates decline with age, the aging of the baby-boom will mean increasingly higher shares of older households who move less frequently. While there are concerns, most notably expressed in Dowell Myers’ insightful book Immigrantsand Boomers, regarding the potential future problem of elderly baby-boomers unloading a glut of housing on the market as they sell off or otherwise cease to head their own households, the oldest boomers are still only in their late 60s and so mostly many years from exiting the housing scene. And if for-sale inventories continue to remain tight as they are today, we may need to worry about the opposite problem: not enough turnover in the housing market to meet the needs of younger households, at least until boomers do reach the ages when they begin to vacate their homes in significant numbers. At present, it’s still hard to tell how much of the currently tight inventory is due to lingering effects of the housing downturn from longer term demographic shifts. Time will tell.