Friday, November 6, 2015

Can Demolitions and Property Rehabilitations Alter Nearby Crime Patterns?

Senior Research
Associate
The potential for vacant and abandoned structures to attract crime has long concerned local policymakers. Newly vacant structures may attract crime, to the extent that they contain appliances, copper pipes, or other targets for burglary and theft. Additionally, abandoned structures offer suitable locations for criminal activity away from the public eye, such as public order offenses like vandalism or drug use. The presence of such crimes can reduce public safety for other neighborhood residents and require public dollars to police.

The foreclosure crisis sparked increased anxiety about these issues in many communities where concentrated foreclosures left properties vacant. Indeed, a large and growing body of research indicates that foreclosures caused increased crime during this period, largely as a result of the vacancies that occurred during the foreclosure process. In addition to the possibilities mentioned above, researchers hypothesized that foreclosures might increase crime through several additional channels: falling property values might reduce the local resources available for crime prevention; turnover of neighborhood residents might reduce the extent of monitoring in public spaces; and, reduced maintenance might alter offenders’ perceptions about whether the unit is occupied.

These potential vectors for increased crime raise important questions about what options are available to policymakers who seek to prevent vacant properties from becoming sources of blight to their surrounding communities. A recent Joint Center for Housing Studies working paper examines one possible strategy, measuring the extent to which demolitions and property rehabilitations effectively reduced the incidence of crime on or near foreclosed and vacant properties. Specifically, this paper measures the impacts of demolitions and property rehabilitations funded by the Neighborhood Stabilization Program between 2009 and 2013 in Cleveland, Chicago, and Denver. For more information about the Neighborhood Stabilization Program, additional analyses are available here, here, and here.

These three maps below show the location of demolitions and property rehabilitations in Cleveland, Chicago, and Denver. The number, type, and location of NSP activities are displayed, overlaying this information with shading that illustrates the underlying rates of crime in the neighborhoods surrounding the property demolitions and rehabilitations. The working paper measures the average impact of demolitions and property rehabilitations on the incidence of crime that occurs on the property or within 250 feet in any direction. This distance increment reflects the impact of these investments on the property itself or in the areas immediately adjacent to the property (relative to the trend observed in other areas of the neighborhood).

In addition, the map for Denver shows a small number of financing activities which provided down payment assistance to low-income homebuyers to purchase homes that had recently experienced foreclosure. Unfortunately, the number of such properties is too small to allow similar analysis of whether the reoccupancy of these properties affected the incidence of crime or near the financing properties.

https://blogger.googleusercontent.com/img/b/R29vZ2xl/AVvXsEjYylssnfUPVxG_dTqN7b11OP7v9QRo1xRNMG8wSS2GVfIsL5dGuLCyJlYP7Ez-H-xTFQp7znidtDwaqw50Zz4Qr7VaGf1c_Pst7CpI6u1ZT5KauxZDK27B23ICH7l0Nb79pnw6zhAwuZic/s1600/Cleveland+7-29-15+-+same+quartiles.jpg

https://blogger.googleusercontent.com/img/b/R29vZ2xl/AVvXsEh-TqQZYjMlkQhjNabgzso0QbCnJS3BvB9H_yLVUDeEGvD4mG8l05exC0nei7oIH8vY6veuFFSGCIfMNyzA6sK_WPgvbNI1sRZb08JYnUlP1eEfNc3Sm7cwhtdGwnFrxN7FZ2VW-r7829jD/s1600/Chicago+7-29-15+-+same+quartiles.jpg 

https://blogger.googleusercontent.com/img/b/R29vZ2xl/AVvXsEiYW-dZ8nhG1TJIO4kORaEqh_DxqoTMtDNxvWM7YcSPr8vDkC5nIdTqBMmoAyRmR2EAaGf9KvNv4aXRa7R5ql91xlNUEhlCxsKoZ0bS0Ri9c-L3Xo_pYqXBzheWc8cuKFgR7sZ14qWkzxjy/s1600/Denver+7-29-15+-+same+quartiles.jpg

The results suggest that the demolitions conducted by the NSP grantee in Cleveland reduced the incidence of burglary and theft within 250 feet of the demolished properties. The measured impacts of demolitions were present during the period of the demolition and persisted for one year following the demolition, before dissipating. In total, these estimates imply a reduction of just over 1 reported property crime for every 2 demolitions completed.

The findings do not show similar impacts for the observed set of property rehabilitations in Cleveland, Chicago, and Denver, nor for the observed set of demolitions in Chicago. Because the sample sizes are much smaller for these activities, we are unable to determine whether these activities had no impact on crime, or whether this outcome is due to limitations of the study’s data and methods. For example, the set of property rehabilitations conducted in each city, as well as the set of demolitions in Chicago, each included a heterogeneous set of property  and neighborhood types, which may limit the estimates of the ‘average effect’ of these investments.

Nonetheless, the findings carry useful implications about the potential for demolitions to alter nearby crime patterns. The direct implication is that a strategy of concentrated demolitions may be effective in altering neighborhood crime patterns under certain conditions. The map of Cleveland above illustrates the extent to which Cleveland clustered its demolition activity, targeting its demolitions primarily to neighborhoods with high levels of vacancy and abandonment. The reductions in crime surrounding these demolitions add to the potential benefits that policymakers should consider in weighing the use of demolition to remove vacant and abandoned properties. The caveat is that the size of the impacts is relatively modest. Policymakers will need to weigh the overall benefits of demolishing vacant and abandoned structures against the costs—which averaged $13,970 per demolition for the NSP program.

Some caution is also needed in applying the findings to other neighborhoods and cities. As the above discussion suggests, the estimates reflect Cleveland’s use of concentrated demolitions in neighborhoods with high levels of vacancy and abandonment and moderate levels of crime. Their demolition strategy might therefore be readily applied to nearby Midwestern cities facing similar challenges, but could be less exportable to neighborhoods with different levels of crime, different built environments, or that are located in different regions of the United States.

Friday, October 23, 2015

Variable Population Growth is Driving an Uneven Housing Recovery in the Nation’s Large Metropolitan Areas

by George Masnick
Senior Research Fellow
We easily accept the proposition that the housing recovery will be greatest in parts of the country where population growth and job growth are occurring more rapidly. But we often forget that the longer-term trends in population growth that drive housing demand are not only highly variable across metropolitan areas, but also tend to be persistent over time within metros. Places leading the housing recovery are the same places where the engines of population growth have had the greatest long-term sustained horsepower. These are places where the young adult population is growing most rapidly. Such places have younger age structures because they are destinations for both international and domestic migration, and their younger age structures sustain population growth from higher natural increase as well. Slow growth metros, where the demand for new housing is lower, are generally places with older age structures and a lack of net in-migration – places where these variables are not likely to change in a fundamental way in the foreseeable future. That being said, there have been changes in population growth among the nation’s large metros since the end of the Great Recession that are worth noting. Metros that have grown more slowly since before 2010 are still trying to put the effects of the economic downturn behind them. Metros that have higher population growth 2010-2014 are generally those where rising housing prices and rents have squeezed household budgets most severely.

The latest release of Census Bureau 2014 population estimates for metropolitan areas underscores the existence of large differences in population growth among the nation’s large metros. The nation’s 100 largest metropolitan areas in 2014 are home to about two thirds of Americans. The largest of these is the New York-Northern New Jersey-Long Island metro at just over 20 million, and the smallest is Durham-Chapel Hill at about 550,000. If we compare population growth that took place during the first decade of this century with what has occurred more recently, we can see both the longer-term growth differences among metros and identify places where population growth has accelerated or declined between 2010 and 2014.

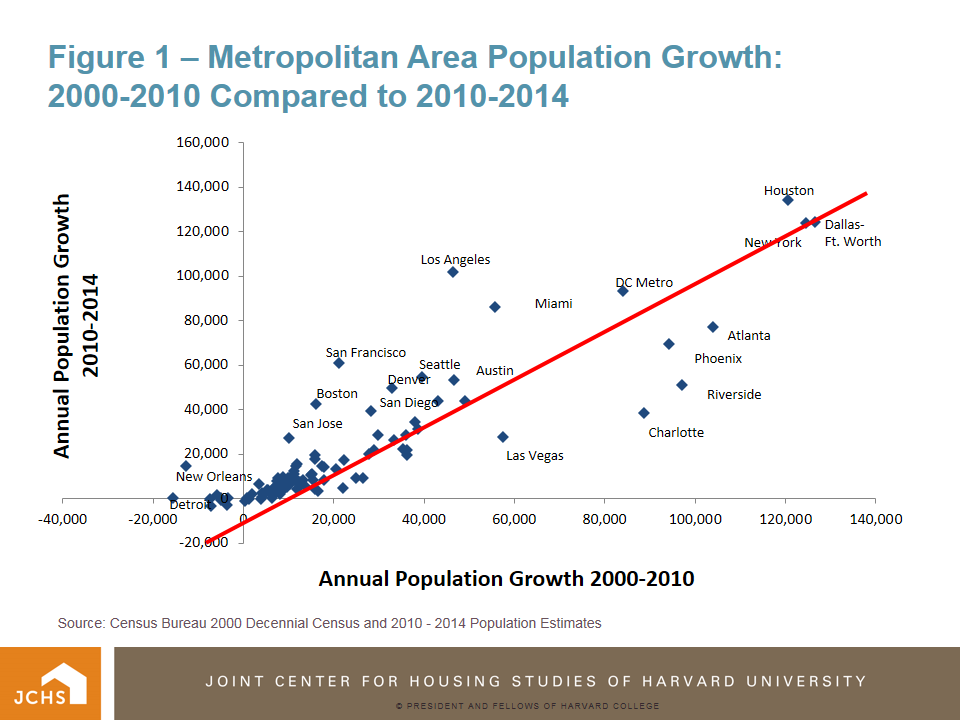
Figure 1 plots annual population growth in the 97 of the 100 largest metro areas in 2010 that also made this list in 2014. Most of the 97 metros cluster together at under 25,000 annual population growth for both periods, and are growing moderately, slowly, or not at all. Only a couple of dozen metros exhibit population growth that sets them apart. For these, the higher the population growth in 2000-2010, the higher the growth in 2010-2014. For example, the Houston-Sugarland-Baytown metro area added an average of 123,000 people per year in the decade 2000-2010 and 134,000 per year from 2010 to 2014. Dallas-Fort Worth-Arlington increased 126,000 annually during the 2000s and 124,000 annually so far this decade. New York-Northern New Jersey-Long Island grew at an annual rate of 124,000 during each period.

https://blogger.googleusercontent.com/img/b/R29vZ2xl/AVvXsEgYADZ5qn8CPCuBSAVXqeUbrWBTtrxZ7ShDBsOD1PHFC8HRiVTrC5il4H2QF25Z35Y0XQS4feWy8GhayVXhr-YFAjw77cpdYfxdCTIbdgUT-cgYEDXU2SJsr_77G7ZM-AHFMPR5SqW8DkMa/s1600/Masnick_fig1.PNG

The diagonal red line separates the scatterplot into metros that grew at a faster numerical annual rate during 2010-2014 compared to 2000-2010 (above the line) from those that grew more slowly (below the line). Among other moderately-higher growth metros, Atlanta-Sandy Springs-Marietta, Phoenix-Mesa-Scottsdale, Riverside-San Bernardino-Ontario, and Las Vegas-Paradise have grown more slowly since 2010, while Los Angeles-Long Beach-Santa Ana, the DC-VA-MD-WV metro, and Miami-Fort Lauderdale-West Palm Beach have grown more rapidly. Some metros with moderate growth during the previous decade have begun to grow more rapidly and add 30,000 or more people per year during the first half of the current decade. In addition to San Francisco-Oakland-Hayward and Boston-Cambridge-Quincy, Seattle-Tacoma-Belleview, Denver-Aurora-Lakewood, San Jose-Sunnyvale-Santa Clara and San Diego-Carlsbad are on this list of metros with significantly increased population growth. These are also places with the greatest increases in housing prices.

The Charlotte-Gastonia-Concord metropolitan area is an outlier in how much slower its population has grown in the recent period compared to 2000-2010. Such a slowdown should be surprising since Charlotte was not hit by the Great Recession and the bursting of the housing bubble as much as other metros falling well below the red line in Figure 1. In fact, its faster growth during 2000-2010 stems primarily from a large (+26%) adjustment to its baseline 2010 census count. It is the only metro in the top 100 with such a large percentage adjustment, which the Census Bureau states could be "due to legal boundary updates, other geographic program changes, and Count Question Resolution action."

Decomposing population growth into its two broad components, net migration and natural increase (excess of births over deaths), allows us to better understand these recent metropolitan population growth trends. Figure 2 shows that the greater the net migration the greater the natural increase. Since migrants are generally young adults, metros that are migrant destinations have a greater excess of births over deaths. This is especially true of metros like Houston-Sugarland-Baytown, Dallas-Fort Worth-Arlington, DC-VA-MD-WV and Atlanta-Sandy Springs-Marietta, where both domestic and international migration are strongly positive (Table 1). Places that are retirement destinations like Miami-Fort Lauderdale-West Palm Beach, Orlando-Kissimmee-Sanford, and especially Tampa-St. Petersburg-Clearwater, have much lower rates of natural increase (fewer births and more deaths) because of their older age structures.
https://blogger.googleusercontent.com/img/b/R29vZ2xl/AVvXsEhFeK4nTXZKN_TMCTkJIwRnktTNPc60bGU5m002VytkYwMpKLE2TdQio1nxeJ8B1sbl0Tj0QQLcBN5Ec4qr-R4Vx-iu7c3WX5YebDw5o0ERH24B8_dTr_VlJmsNFl6T-5NITGQqUtgSC6V3/s1600/Masnick_fig2.PNG

New York-Northern New Jersey-Long Island is an outlier, with its high level of international immigration largely being offset by domestic outmigration (annually 141,000 and -124,000 respectively during 2010-2014). But the New York metro’s high share of minority population (50.2 percent according to the 2010 census) produces a large growth from natural increase because of younger age structure and above-replacement fertility for minorities. Los Angeles-Long Beach-Santa Ana’s profile is similar to New York’s in that levels of recent annual international in-migration are offset by high levels of domestic migration losses (62,000 and -49,000 respectively), and its high natural increase is fueled by its minority population (67.6 percent in 2010). The Chicago-Naperville-Elgin metro area has recently experienced more than twice the level of domestic out-migration than immigration according to Census Bureau estimates. Still, Chicago’s minority population (46 percent in 2010) produces a significant level of natural increase, which has kept the Chicago metro’s overall population growth positive.

https://blogger.googleusercontent.com/img/b/R29vZ2xl/AVvXsEiNSPjt3PUBUGl6NAxXIn_1KullPPkQOvey0Mno2E3AUA43Ldt67saXAu9qe6qwxF2LIU9oIZdO57PEIvWKJSfOAfneqKVuzAnKOdXUKawulZ2F6fujbzZLWrFI8rnpGWAU9tZV50RJu9XE/s1600/Masnick_table1.PNG

Population age structure and percent minority are demographic characteristics that change little from year to year, and these are the characteristics that largely determine growth from natural increase. Places with high natural increase should continue to produce and excess of births over deaths. Looking forward, unless patterns of domestic or international migration change dramatically in the short run, high-growth metros should remain high and low-growth metros remain low.

Thursday, October 15, 2015

Remodeling Spending Expected to Accelerate into 2016

by Abbe Will
Research Analyst
After several quarters of slackening growth, home improvement spending is projected to pick-up pace moving into next year, according to the Leading Indicator of Remodeling Activity (LIRA) released today by the Remodeling Futures Program at the Joint Center for Housing Studies of Harvard University. The LIRA projects annual spending growth for home improvements will accelerate from 2.4% last quarter to 6.8% in the second quarter of 2016.

Home improvement spending continues to benefit from the last years’ upswing in housing market conditions, including new construction, price gains, and sales. Strengthening housing market conditions are encouraging owners to invest in more discretionary home improvements, such as kitchen and bath remodeling and room additions, in addition to the necessary replacements of worn components such as roofing and siding.

Although we expect remodeling activity to strengthen through the first half of 2016, further gains could be tempered. Current slowdowns in shipments of building materials and remodeling contractor employment trends, as well as restrictive consumer lending environments, are lowering remodeler sentiment and could keep spending gains in the mid-single digit range moving forward.

https://blogger.googleusercontent.com/img/b/R29vZ2xl/AVvXsEhw-cwzT8MGXfYnhnP9c1NuAV5pQf6lhARx-Bd02NOvgT5jUrgIMiPBeCp9fkGh2X-nuTD2T5AcoI27iojMVOjDANi8sAYmWSppWvlW650x_1qVJBE-TQ6Im4cvz-h4S1ZnnYLfKWeY8XZ_/s1600/lira_2015_q3_fullsize_jchs.PNG
--
The Leading Indicator of Remodeling Activity (LIRA) is designed to estimate national homeowner spending on improvements for the current quarter and subsequent three quarters. For more information about the LIRA, including how it is calculated, please visit the LIRA page on the Joint Center’s website. The LIRA is released by the Remodeling Futures Program at the Joint Center for Housing Studies in the third week after each quarter’s closing.

Monday, October 5, 2015

Single-Family Rentals Have Risen to Nearly a Third of Rental Housing

by Rachel Bogardus Drew
Post-Doctoral Fellow
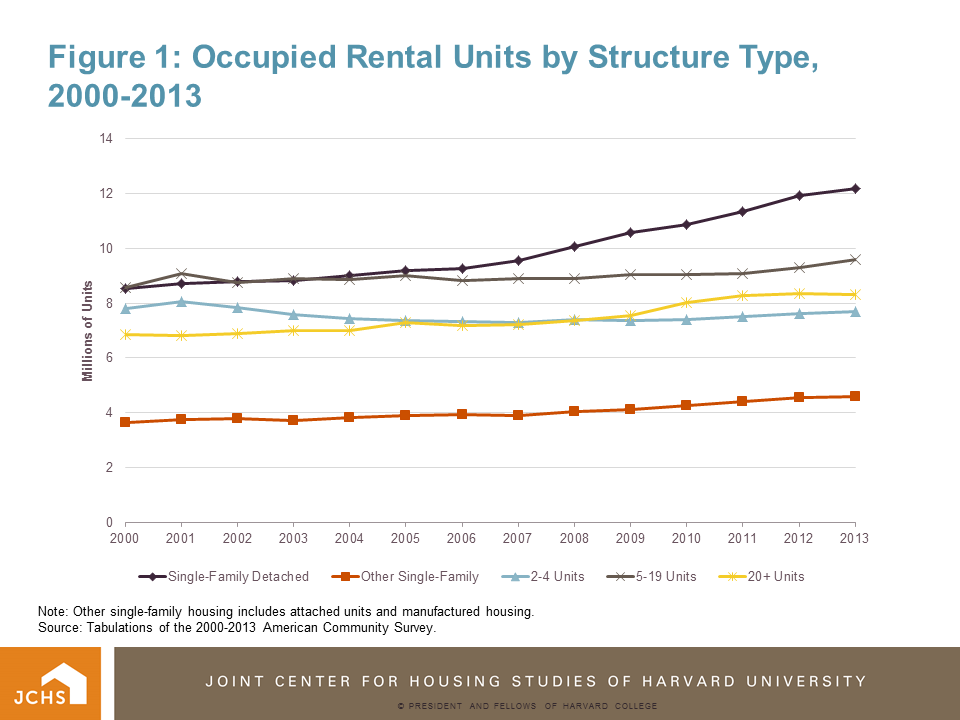
According to the Census Bureau, the national homeownership rate dropped again in the second quarter of this year, to 63.4 percent. This level represents a nearly 50 year low, and continues the trend of declining homeownership that has been in effect since the end of the mid-2000s housing boom (see my previous blog post on this topic). The flip side of lower homeownership rates, however, is higher shares of households renting their homes. Indeed, rental housing is now more in demand than it has been for decades. While new construction of rental units has picked up in response to this demand, the majority of it has been served by conversions of existing units from owner- to renter-occupied, mostly from the single-family housing stock. As a result, since 2006 the number of single-family detached homes occupied by renters has increased by a third, from 9 million to over 12 million (Figure 1), and now accounts for 29 percent of all rental housing.


https://blogger.googleusercontent.com/img/b/R29vZ2xl/AVvXsEgqouy3qO0IcdNpUY6-P1ExE3CafOVWUUSf607evEoMIQZuDbMJw8LE5QWUoKyBGJIUyiFLRitKtQHLytViPicRAnoK1RWNPTBBIS3JZfv9VfG8kIQwojhMamj3Jv6CNSUvM3RIoVJ1cto9/s1600/Slide1.PNG
Note: Other single-family housing includes attached units and manufactured housing.
Source: Tabulations of the 2000-2013 American Community Survey.


My newest paper takes a new look at single-family detached rental housing, exploring the ways in which the stock and residents of these units differ from other rental housing, and how they have changed over the last decade. It finds that single-family rentals offer an important alternative to single-family owned and multifamily rental housing. Specifically, single-family rentals allow their residents to reap many of the advantages of single-family living, such as larger units than typically found in multifamily housing, while retaining the affordability and flexibility that makes renting an attractive option to households that do not or cannot own. Because most single-family rentals were formerly owner-occupied, however, they tend to be smaller, older, and have fewer amenities than currently owned single-family units (Figure 2).

https://blogger.googleusercontent.com/img/b/R29vZ2xl/AVvXsEh3rJMQHmVNiBlDRKH2KAdKzzpFFBbMBnLXtiKglnEnvh4rgisLDXxoZyqJeLauGxrXGTG3YWKgKK502JB9KgkDuPg7Nv1EKI9qAThySaODgMKGtAHnoIUxiO6BJedIv-Z-G6_3edqLwPBA/s1600/Slide2.PNG
Note: Other rentals include rented single-family attached and manufactured units.
Source: Tabulations of the 2013 American Community Survey.

While the characteristics of single-family rentals align closely with those of single-family owned units, residents of these homes more closely resemble other renter households. For example, the share of minority households among single-family detached renters (39 percent) is closer to the share among multifamily renters (48 percent) than among single-family detached owner-occupants (21 percent). The same is true of the age distribution of households; 30 percent of single-family renters are under age 35, compared to 38 percent of multifamily renters in this age group but only 10 percent of single-family owner-occupants. The pattern breaks down by family type, however, as single-family detached rental units stand out as having the highest share of families with children (Figure 3).

Note: Multifamily rentals include rented single-family attached and manufactured units.
Source: Tabulations of the 2013 American Community Survey.


While single-family rentals have characteristics that are different from single-family owned and multifamily rental units, also of interest is how these units have been changing as they have grown to become a larger segment of the rental stock. Looking at these changes over time may provide some insights into whether the recent surge in single-family detached rentals is a harbinger of housing demand going forward, or a temporary reaction to the downturn in the housing and home buying markets. Most changes observed over time in the structures themselves, for instance, reflect the evolution of single-family housing in general, which continually replaces smaller, older units leaving the stock with larger and newer units in desirable locations. Some changes in the characteristics of single-family renter households, however, do not follow the same trends as in all households. One notable example of this is the share of middle-aged households (i.e., headed by someone age 35-54), which has been declining in recent years among all housing types except single-family rentals (Figure 4). The same is true of families with children, who generally prefer the features associated with single-family housing, even if they do not or cannot own their homes.

https://blogger.googleusercontent.com/img/b/R29vZ2xl/AVvXsEhLJ_fa13ytWcY_s-R4BCoQ2tckU54FDd6rhh5tNpsu2TDMRrfiMwrKykBTiJw4iXa_iJn43GOxCzrWmL1C2dL4vLbWb82xUbTYae6MCMH1T05IM3Knfwngs0I2Yb2T_jdO0_QqnjkaKu_m/s1600/Slide4.PNG
Note: Multifamily rentals include rented single-family attached and manufactured units.
Source: Tabulations of the 2000-2013 American Community Survey.

It is unlikely, however, that these shifts represent a permanent change in the rental market. The middle-aged and family households that account for large increases in single-family rentals are traditionally those most active in the trade-up and first-time home buying market. If economic conditions change in the near future such that home purchases become affordable and attainable to more households, these new classes of single-family renters will probably be among the first to seize their chance to own their own home. In such an event, detached single-family units will decline as a share of all rentals, though likely only back to their former level of around a quarter of the stock, as these units will continue to provide alternative to multifamily rentals and single-family homeownership, and a necessary component of the national housing stock.

Monday, September 21, 2015

Enterprise and JCHS Project Renter Burdens in 2025

by Chris Herbert
Managing Director, JCHS
and by Andrew Jakabovics
Sr Director, Policy Development & Research
Enterprise Community Partners
Earlier today, Enterprise Community Partners and the Harvard Joint Center for Housing Studies released Projecting Trends in Severely Cost-Burdened Renters: 2015–2025, which examines how demographic and economic trends over the next decade are likely to affect the near record number of renters with severe housing cost burdens—that is, paying more than half their income in rent. The bottom line: assuming current economic conditions remain constant, we expect demographic trends alone to increase the number of severely cost-burdened renters by 11 percent to 13.1 million in 2025, up from 11.8 million in 2015. On the other hand, if current trends continue, where rent gains outpace income growth, the number could reach 14.8 million. Even in the unlikely event that the next decade sees sustained gains in incomes relative to rents, the number would decline only slightly. In short, the renter affordability crisis is unlikely to abate and is more likely to get a whole lot worse.

Since the start of the 2000s, the U.S. has seen an astounding growth in severely cost-burdened renters, from 7.0 million in 2000 to 11.3 million in 2013. Several factors have contributed to this growing housing affordability crisis. Over this whole period, rents have been growing faster than incomes, and since the housing crash the homeownership rate has been plunging, producing record growth in renter households. With supply struggling to keep up with demand, rental markets have tightened, further exacerbating affordability challenges. There simply has not been enough affordable rental housing to meet growing needs, particularly among low- and moderate-income households.

Given these troubling trends, Enterprise and the Joint Center set out to assess whether the rising tide of renters struggling to find housing they could afford was likely to abate. The starting point for these projections are Census Bureau population estimates that call for an increase in the adult population in the U.S. of 24.6 million between 2015 and 2025. The Joint Center estimates that the expansion in population will result in the formation of 12.4 million net new households, of which at least 4.2 million will be renters. From these estimates, we then project how many households will be severely rent burdened in 2025 under differing assumptions about real changes in income and rent levels.

In our baseline scenario (where both rents and incomes grow in line with inflation, set at 2 percent), we find that demographic trends alone would raise the number of severely burdened renter households by 11 percent to 13.1 million. In addition to the baseline model, we run four alternative scenarios where annual income growth exceeds rent growth by 0.25 percentage point increments (topping out at 3 percent annual income growth versus 2 percent rent growth), as well as four scenarios where rent growth exceeds income growth in 0.25 percentage point increments. We find that for each ¼ increment in rent gains relative to incomes, there will an increase of 400,000 more severely burdened renters.

Under the most extreme case tested where rents outpace incomes by a full percentage point, we would see a 25 percent increase in cost burdened renters over the next decade. Conversely, for each quarter point gain in incomes relative to rents there would be a decrease in severely burdened renters of 360,000. But given the demographically-driven increases that are expected, even in the case that income growth is a full percentage point higher per year than rents, the number of severely burdened renters would only fall by 169,000 relative to today’s levels—hardly any progress at all.

Figure 1:

https://blogger.googleusercontent.com/img/b/R29vZ2xl/AVvXsEgldXihooi3YkQ15P_wyL7P83KCbob4o2TCKEcs00dSwjMXfs2L3eA9oM4PmJ6ceOIVM6YFM58omAsHfzgVhVSAgkO6pxQl0nM36bAIEnTTULZdtonhyZgYmz9rdWWuPbSw9e0Ld7IWLBsj/s1600/enterprise_graph1.png
*Notes: Severe burdens are defined as housing costs of more than 50% of household income. Base case assumes 2% annual growth in rents and incomes in 2015-2025. Lowest-burden scenario increases annual income growth rate to 3% while holding income growth of 2%.

It’s also worth noting the unlikelihood that income growth will exceed rent growth by 1 percent every year for the next 10 years. Since 2001, changes in rents have consistently outpaced incomes, and that trend has only continued since the Great Recession. We do not anticipate income and rent trends to change drastically over the next 10 years, thus reducing the likelihood that the number of severely cost burdened renters will fall.

We also analyzed the distribution of impacted households by age, race/ethnicity, and household type. The baseline scenario highlights the significant influence of two broad demographic trends on housing affordability: the rapid aging of the population and the growing racial and ethnic diversity of younger households. When breaking the data out by age, the largest shares of burden would be among older adults and millennials. Among older adults, the number of severely burdened households aged 65-74 and those aged 75 and older are expected to rise by 42 percent and 39 percent respectively. These numbers illustrate a critical need for elderly housing and services that help individuals age in place.

Hispanic households are projected to have a 27 percent increase in severe renter burdens under the baseline scenario, which is the highest rate among any race/ethnicity. Given the Hispanic population’s projected growth in the U.S., this finding is not surprising. Following Hispanic households are Asians and other non-black minorities at 23 percent and non-Hispanic blacks at 11 percent, compared to only a 0.5 percent increase for white households. Hispanics account for a large share of gains in burdened households under all our scenarios, although if rents continue to grow faster than incomes, whites will account for a larger share of the rise. Under the most optimistic scenario where incomes grow faster than rents by a full percentage point, the number of severely burdened minority renters will still increase by 435,000, offsetting a small decline among white.

Finally, when analyzing the findings by household type, under all scenarios the largest growth rate is expected to be among married couples without children—attributable to the baby boomer–driven growth in older couples whose children have grown up and moved out. This is followed by the millennial-driven growth in the number of married couples with children, and the growth in single-person households, who account for the largest absolute increase in burdened households primarily driven by older adults who are more likely to live alone as they age.

https://blogger.googleusercontent.com/img/b/R29vZ2xl/AVvXsEjorDxWlefhcLNxyeYELrv9WYMIKEvLW3BLe8KrZ-mE8fqwisv_Vg_RwSpYXKpClEjLFpY-vUubK7txLRHrFWpCRSPkFyyhinGPia9mdbO4ttXPXVwTKkb-dw3qFSVW375mew0i75w6n5-0/s1600/enterprise_graph2.png

Overall, these projections lead to the sobering conclusion that severe renter burdens are likely to worsen over the next 10 years, particularly for older people, non-white households, married couples and single people. As it is, only about one if four income eligible households receive housing assistance today. Our projections indicate that this share will only get lower if more isn’t done to meet this burgeoning need. Given these findings, it is critical for policymakers at all levels of government to prioritize the preservation of existing affordable housing and expand supports for additional housing assistance to keep up with the need that is likely to continue to grow.

Learn more about our findings in the full paper, Projecting Trends in Severely Cost-Burdened Renters: 2015-2025.