Wednesday, August 31, 2016

How Do US Renters Fare Compared to Those Around the World?

by Michael Carliner
Senior Research Fellow
The Joint Center’s biennial America's Rental Housing reports examine the rental housing market in the US and have documented the increasing cost burdens faced by renters in this country. To provide further context for US rental housing, Ellen Marya and I looked at rental housing in a number of other advanced countries in a new working paper. Although numerous countries, as well as the European Union, issue reports with rental housing data, they use different measures of income, housing cost, affordability, unit size, number of rooms, and quality, making comparisons difficult. To develop comparable measures, we obtained and analyzed household survey data from Canada and ten European countries, as well as several US household surveys.

 Click to enlarge
Notes: Data for 2013, except Canada 2011
Sources: U.S. Census Bureau, American Housing Survey; Statistics Canada, National Household Survey; Eurostat, European Union Survey of Income and Living Conditions

Figure 1 shows the twelve countries we included. The share of all households who were paying rent in 2013 ranged from 15 percent in Spain to 59 percent in Switzerland. The 33 percent share in the US was in the middle of the range and similar to several other countries. Some non-homeowning households were living rent-free, generally because of their employment or relationship to the property owners. Such rent-free occupants represent a small share of households in the US and most other countries, but account for more substantial shares of households in Italy, Spain, and Austria.

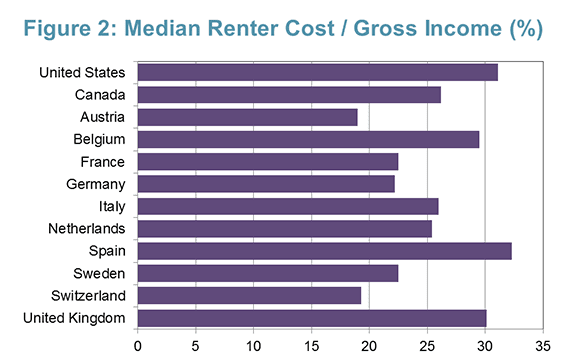
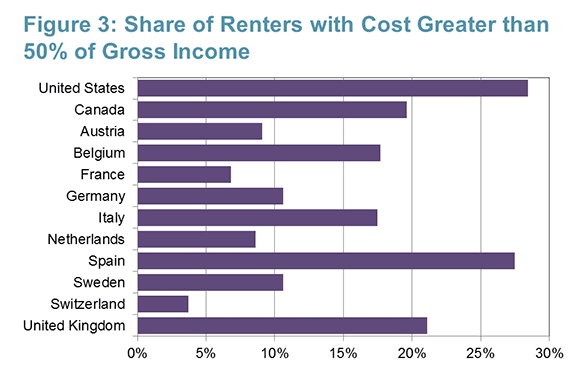
Comparing rental markets in the twelve countries revealed that the US was exceptional in a number of (often unfavorable) ways. The median ratio of housing cost to household income (Figure 2) was greater in the US than in any of the other countries studied, except for Spain, where there are relatively few renters. Moreover, the share of renters with severe cost burdens — paying more than 50 percent of their income for housing — was greater than in any of the other countries (Figure 3.)
 Click to enlarge

 Click to enlarge
Notes: Data for 2013, except Canada 2011

Other exceptional characteristics of renter households in the US included an average household size of 2.39, which is greater than in any of the other countries, except Spain. The share of US renter householders aged 65 or over (12.1 percent) was less than in any of the other countries, again with the exception of Spain. Also, the share of renters living in single-family detached houses was much higher in the US compared to the other countries.

In many other respects, rental housing in the US was not exceptional. While the median living area and number of rooms in US rentals is greater than in most of the other countries, several countries had comparably-sized rental units, especially after adjusting for the number of occupants. (This is in contrast to owner-occupied housing, where units in the US tend to be substantially larger than those in other countries.)

In all of the countries studied, foreign-born householders were more likely than native-born householders to be renters. In the US, 14 percent of all householders, and 20 percent of renters were foreign-born. The foreign-born share of all householders ranged from 7 percent in Germany to 38 percent in Switzerland. The foreign-born share of renter householders was more than 45 percent in Spain and Switzerland.

In each country, lower income households were more likely to be renters than those with relatively high incomes. In the US, about 33 percent of renter households were in the lowest quintile of the income distribution. In six of the other countries, the share of renters in the lowest income quintile were greater than in the US, so the US did not exhibit unusual concentration of rentership at the low end. Because of greater overall income inequality in the US, however, households in the bottom quintile had lower incomes, relative to the national median. Indeed, the median income of households in the bottom income quintile in the US (the 10th percentile) was 24.5 percent of the overall median household income, while among the other countries that ratio ranged from 27.9 percent to 39.1 percent.

Much of the focus of our analysis was on affordability and on the reasons why it is a greater problem in the US than elsewhere. The degree of income inequality is one factor. Another important influence on renters' cost was the availability of housing allowances, known in the US as vouchers. Although US renters with vouchers are provided with fairly generous subsidies, only a small share of renters actually receive vouchers. In France and the UK, about half of all renters benefit from housing allowances. In the Netherlands, Sweden, and Germany, as well, large shares of renters receive housing allowances. Our analysis shows that the effects of housing allowances on affordability are substantial in those countries.

Although affordability in the US is typically measured by comparing housing cost to gross (before-tax) income, in Europe it is common to look at housing cost relative to disposable (after-tax) income. On that basis, the median ratios of housing cost to income for renters in Belgium, the Netherlands, UK, and Spain, were higher than in the US, where taxes are lower. But the share of renters with severe cost burdens (greater than 50 percent of disposable income) was still greater in the US than in every country except Spain.

While the objective of the paper was largely to provide comparable statistics regarding the characteristics of renters and the rental housing stock in a number of developed countries, it underscores the severity of rental housing affordability problems in the US. It doesn't provide a clear answer to the question of how to improve affordability in the US, but it does suggest where to look.

 Read the working paper.

Monday, August 29, 2016

JCHS Fellows Spend Summer on Housing and Community Development

by David Luberoff
Senior Associate
Director
In projects that ranged from efforts to get youth more involved in design issues in Philadelphia, to trying to improve health outcomes for Latino residents of Santa Ana, California, seven Joint Center for Housing Studies Community Service Fellows spent the summer working for non-profit and public entities throughout the United States. The fellowships, which are given to master’s level students at Harvard’s Graduate School of Design, give opportunities to work with organizations that focus on housing, the built environment, and/or community development. Several students blogged about their work.

  • Diana Jih (MLA 2018) worked with Public Workshop and Tiny WPA in Philadelphia.
  • Omar De La Riva (MUP 2017) worked with Latino Health Access in Santa Ana, California.
  • Read all posts by the Joint Center’s Community Service Fellows.
Diana Jih's project with Tiny WPA building a treehouse fort with community volunteers

Thursday, August 25, 2016

Another Look at the Uneven Recovery of Home Prices Across US Metro Areas

by Daniel McCue
Senior Research
Associate
Since the downturn, home prices for the US as a whole have been undergoing a strong recovery and are now approaching their former peak from the mid-2000s. However, the recovery has been uneven across the nation’s metro areas. As of June 2016, median home prices in only about a third of all metro areas tracked by Zillow since 2005 (162 of 474) had regained their mid-2000s peak values. In some metros, home prices remain 20 to even 30 percent below past peaks. To get a picture of the extent to which markets differ, we can examine the recovery in home prices, see where prices stand in metros across the country, and consider the implications of the changes.

At the positive end, some metros have done far more than just recover, with home values rising above past peaks (Figure 1). A few of these metros are hot markets where home values have skyrocketed after substantial declines during the downturn. Examples include San Jose and San Francisco where median home values are now significantly above mid-2000s peaks, following significant declines in the late 2000s. Honolulu and Portland, OR experienced similar trends. However, these four metros are the exceptions, as the majority of metros with above-peak values have not seen particularly strong recent price appreciation and are mostly benefitting from their relatively minor price declines during the downturn. In fact, among the fifteen metros where current home values most exceed past peaks, five had total peak-to-trough declines of less than 3 percent. Five others had declines of less than fifteen percent, which was still well below the US nationwide peak-to-trough decline of 22.4 percent.

 Click to enlarge

At the other end of the spectrum, home values remain far below mid-2000s peaks in several metros, predominately located in the Southwest and Florida. These are areas that had the most severe price declines during the recessionsome declined in excess of 60 percentwhich results in home values that continue to appear depressed despite significant recent rates of appreciation. In fact, metro areas furthest from their former peak values include areas where home values have risen most sharply since the recession. For example, Modesto, California’s median home value has nearly doubled (up 92 percent) since its November 2011 low of $129,400, reaching $248,900 by June 2016. This makes it the metro with the largest percent increase from trough to current, but Modesto’s median home value is still 31 percent below the April 2006 peak of $362,100. This pattern holds true for a number of other metros in California, Florida, Arizona, and Nevada.

Having had a minimal downturn is perhaps the best indicator of whether or not a metro area’s current home values are back above mid-2000s peaks. The top thirteen metros with the smallest peak-to-trough declines in home values over the housing downturn are all fully recovered. These areas were mostly smaller metros located in the Southeast, Midwest, and upstate New York with a history of moderation in home prices. Conversely, the top 24 metros with the largest peak-to-trough declines in home prices during the downturn have uniformly failed to reach their past peak values as of June 2016. Indeed, among the twenty four metros with the largest decreases in home values during the downturn, none have fully regained their peaks. Outside of Detroit, these metros are exclusively located in the West (California and Arizona) and in Florida.

Metros such as Little Rock and Syracuse are at the top of the list relative to past peaks, but are these really the strongest markets for home values? Many areas with the steepest declines since the mid-2000s were also those with the largest run-ups in home values, and the net sum in many cases is still a significant net increase since 2000. Looking at home values relative to year 2000 instead of mid-2000s peaks, we find many of the metros with the highest appreciation since 2000 to be those where home values are still well below peaks from 2005 and 2006 (Figure 2). Meanwhile, many of the slow-growth metros where home values are highest when measured relative to peaks, such as Little Rock and Syracuse, have seen much lower net price appreciation over the longer period.

 Click to enlarge

There are several possible takeaways from this analysis:
  • The housing recovery has been uneven across metro areas. While home values in the US are approaching past peaks, two thirds of metro areas are still below past peak levels from the mid-2000s. 
  • Whether or not home values in a metro area have recovered to past peak levels depends on the size of the downturn in that metro. 
  • Metros with the largest downturns, as a group, are seeing high rates of appreciation in recovery, but the majority have not yet recovered big losses and are still below past peaks. 
  • Being below past peaks does not mean home values are low.  In metros where home values are currently furthest below mid-2000s peaks, home values are still well above levels from 2000.
  • In many of the metro areas that are still well below mid-2000s peaks, net appreciation in home values since 2000 has actually been greater than in areas currently well above mid-2000s peaks that have had more modest rates of appreciation.

Overall, this data appears to suggest a trade-off between risk and return playing out across metropolitan area home values in the US. The high levels of appreciation since 2000 in the highest-growth areas have come with extreme volatility and the need to ride out the downturn successfully. Indeed, one cannot discount the significant housing wealth lost with the downturns, and the fact that those benefitting from recent recovery in prices are not always those who lost out in the downturn. However, while they have received more modest appreciation in home values since 2000 relative to those in high growth areas, homeowners in low-growth areas have not missed out on the ability to build wealth through housing either. Perhaps for many, the moderation of downside in these metros makes their modest housing appreciation look more appealing.

Monday, August 22, 2016

State and Local Governments Take Action to Promote Affordable Housing

by Daniel McCue
Senior Research
Associate
Home prices are rising, rents are up, and units available for rent or sale are few and far between. Detailing these trends, our 2016 State of the Nation’s Housing report once again finds affordability concerns at the top of the list of US housing challenges, both in metropolitan areas and rural counties. But with assistance reaching just 26 percent of households that qualify for it, the federal response has not been able to keep up with the growth in low-income households in need of affordable housing. Faced with this challenge, states and municipalities are increasingly looking beyond federal programs to take whatever action they can to increase the supply of affordable housing.

So what are they doing? In a recent article posted on the Shelterforce Rooflines blog I look at how state and local governments—those who are most commonly tasked with implementing federally funded programs—are increasingly working independent of federal programs and using their own resources to increase the supply of affordable housing in their areas.

Thursday, August 18, 2016

Emerging Consumer Interest in Home Automation

 by Abbe Will
Research Analyst
Home automation is poised for significant growth with the rising prevalence of smartphone use, advancements in wireless technologies, and entrance of the millennial generation—the largest and arguably most tech-savvy generation to date—to the housing and home improvement markets. To better understand this emerging market segment, our Remodeling Futures program is undertaking research to measure the current and future size of this market, investigate the most promising technologies and services for homeowners, identify key players operating in the market, and explain homeowners' perceptions of the benefits and drawbacks to automating their homes.

A first look at homeowner attitudes and behaviors around home automation trends comes from a 2015 consumer survey by The Demand Institute. According to Joint Center tabulations of this survey data, of homeowners who said they were likely to do a home improvement project in the next three years, nearly half expressed excitement to incorporate more “smart home” technology into their homes, and nearly 30 percent reported that they are somewhat or very likely to install home automation products or features. About 29 percent of homeowners likely to remodel placed high importance on their homes having the latest technology, like built-in speakers, remote-controlled thermostats, electronic window coverings, etc. Another 44 percent said having the latest home technologies was somewhat important. Yet only 16 percent said that their current home could be described as already having the latest home automation technologies, which suggests a large gap in current home automation use and interest (Figure 1).

 Click to enlarge
Note: Provided examples of latest home automation technologies included built-in speakers, remote-controlled thermostats and electronic window coverings. Source: JCHS tabulations of The Demand Institute 2015 American Communities Survey: Consumer Interview data

Compared to homeowners who place little or no importance on their home having the latest automation technologies, those who place a lot of importance on home automation are younger, have higher incomes and home values, and live in more urban areas (Figure 2). These homeowners are also much more likely to be planning a home improvement project of any kind in the next three years—68 percent compared to 56 percent of those placing some importance on having the latest home technology and 44 percent for those placing little or no importance. Over half of homeowners who place a high level of importance on having high-tech homes and are likely to remodel in the coming years reported that they are somewhat or very likely to install home automation products or features (52 percent) compared to 28 percent of homeowners expressing some importance and only 10 percent of owners expressing no importance for having an automated home.

 Click to enlarge
Notes: Tabulations are of responses to the following question: How important is it to you that your home has the latest technologies, like built-in speakers, remote-controlled thermostats and electronic window coverings, etc., where 1=not at all important and 10=extremely important? Very important includes rankings of 8-10, not important includes rankings of 1-3.Source: JCHS tabulations of The Demand Institute 2015 American Communities Survey: Consumer Interview data.

There is a dramatic difference in attitudes toward home automation products and services by age of owner. Only 28 percent of homeowners age 65 and over who are likely to remodel in coming years expressed excitement to incorporate “smart home” technologies, compared to over two-thirds of owners under age 35 who either somewhat or strongly agreed with this sentiment. And where only 13 percent of homeowners age 65 and over reported being somewhat or very likely to install home automation products or features in the coming three years, almost 43 percent of owners under age 35 reported the same intent. A slightly higher share of owners age 35-44 expressed likelihood to install home automation improvements at 45 percent, but this share fell sharply for owners age 45-54 (30 percent) and age 55-64 (23 percent).

Although many homeowners are motivated to automate their homes, it is unclear how thoroughly they will act on their enthusiasm. According to a 2015 poll reported by The Demand Institute, homeowners may be hesitant to fully engage in home automation products and features because of high product costs, security flaws and glitches, and concerns for whether smart products will function as well as traditional home products. More research on the emerging home automation market will be shared in the forthcoming 2017 Improving America’s Housing report.