
 |
| Irene Lew Research Assistant |
As we highlighted in our recent America’s Rental Housing report, the housing
affordability crisis has shown little signs of abating in recent years, as renter
incomes continue to lag behind rising housing costs. Though there has been a ramp-up
in rental housing construction, much of this new housing is intended for renters
at the upper end of the income spectrum (Figure
1). Indeed, in 2013, four in ten new rentals charged monthly rent of at
least $1,000, compared to less than a quarter of rentals built during the heavy
volume of multifamily construction in the 1960s and 1970s, which was largely
supported by federal subsidies. In addition, the median asking rent for new
market-rate apartments has been rising in recent years, reaching $1,372 in
2014, up by more than a quarter from 2012.

Note: Data includes vacant for-rent units and those that are rented but not yet occupied. Excludes no-cash rentals and other rentals where rent is not paid monthly.
Source: JCHS tabulations of US Department of Housing and Urban Development, 2013 American Housing Survey.
New construction is providing relatively fewer rentals that
are affordable to those with lower incomes. According to the American
Housing Survey, new construction increased the total number of units renting
for $800 and over by 14 percent between 2003 and 2013—roughly triple the gain
in the number of units renting for under $400. In fact, just 34 percent
of rental
housing built between 2003 and 2013 rented for under $800 in 2013.
Indeed, there is a mismatch between the type of rental housing built
over the past decade and the needs of growing numbers of lower-income renters. Between
2003 and 2013, the number of low-income renter households who could only afford
units renting for under $400 (at the 30 percent of income threshold) increased
by 40 percent but the number of rental units affordable to these households rose
just 10 percent on net. Most of this 10 percent increase came from the downward
filtering of higher-cost units to lower rents, rather than the construction of
new lower-cost units.
Rental housing
built during the last decade is increasingly out of reach for many renters. This
is true across the metropolitan region. In central cities, nearly half (48
percent) of new units rented for at least $1,000 a month in 2013, in contrast
to just 28 percent of rentals built before 2003. On the other hand, while rentals
in non-metro areas tend to include a higher share of the lowest-cost housing (units
renting for under $400) relative to those in metro areas, new rentals built in
these locations are much less likely than older rentals to charge rents this
low (Figure 2). For example, only 11
percent of single-family rentals built in non-metro areas before 2003 rented
for $1,000 or over in 2013 but this share rises to 53 percent of single-family
rentals built in 2003 or later.
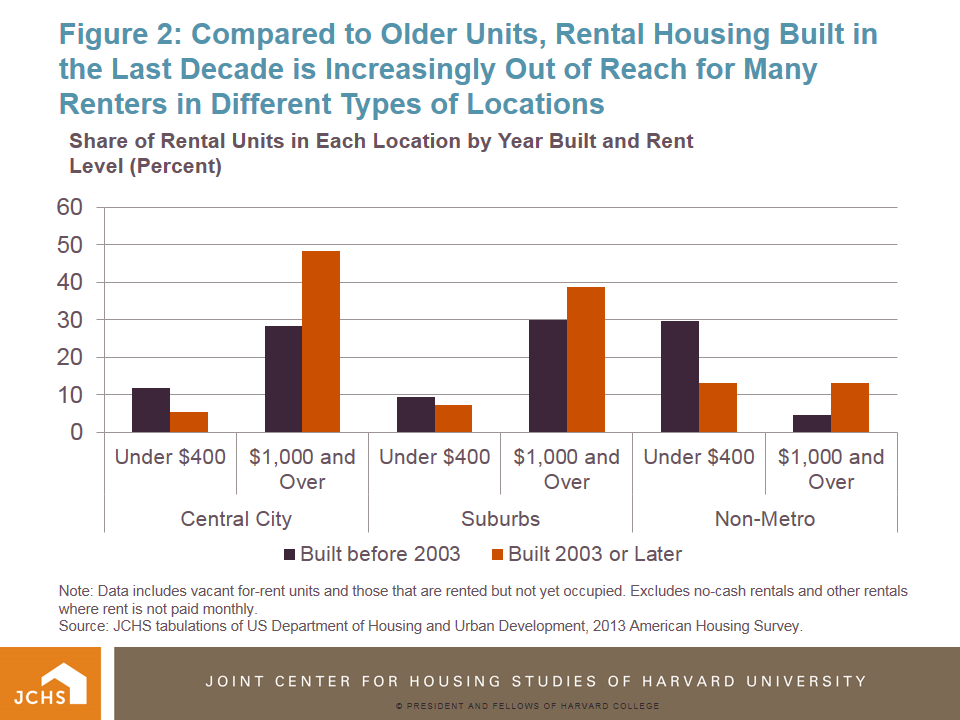
Note: Data includes vacant for-rent units and those that are rented but not yet occupied. Excludes no-cash rentals and other rentals where rent is not paid monthly.
Source: JCHS tabulations of US Department of Housing and Urban Development, 2013 American Housing Survey.
New construction has also tilted toward larger buildings. At
least eight out of 10 apartments (84 percent) completed for rent in 2014 were located
in properties with 20 or more units. This is well above the average share—62
percent—of new rental additions in the previous decade (between 1999 and 2009).
With developers prioritizing the construction of units in large multifamily
buildings, the addition of units in smaller buildings with 2–4 apartments has
slowed significantly. Apartments in structures with 2–4 units fell from 20
percent of multifamily completions in the early 1980s to just 3 percent in 2014.
And according to the 2013 American Housing Survey, units in small buildings
with 2–4 units represented just 16 percent of multifamily rentals built between
2003 and 2013, and just 9 percent of all rental units built over this time
period (Figure 3). In contrast,
apartments located in multifamily buildings with at least 20 units made up the
largest share of new construction—29 percent—during the past decade, followed closely
by single-family detached rentals.

Note: Data includes vacant for-rent units and those that are rented but not yet occupied.
Source: JCHS tabulations of US Department of Housing and Urban Development, 2013 American Housing Survey.
This decline in the number of new rentals in small buildings
with 2–4 apartments is concerning given that units in these structures are typically
more affordable than those located in larger buildings. In 2013, 63 percent of
units in buildings with 2–4 apartments rented for under $800 a month, compared
to 44 percent of those in buildings with 20 or more apartments. The age of
rentals in the smallest multifamily buildings may help explain why these units
tend to be more affordable than those in larger buildings. They tend to be
older, with 44 percent of rental units in the smallest multifamily structures
built before 1960, compared to less than a quarter of units in buildings with
at least 20 units. However, even when accounting for units built in 2003 and
later, those in buildings with 2–4 apartments are still more affordable than those
in larger buildings. Over half (55
percent) of new rentals located in multifamily buildings with 2–4 apartments
rented at under $800 in 2013, compared to just 29 percent of units located in
buildings with 20 or more units that charged rents this low (Figure 4).

Note: Data includes vacant for-rent units and those that are rented but not yet occupied. Excludes no-cash rentals and other rentals where rent is not paid monthly. Source: JCHS tabulations of US Department of Housing and Urban Development, 2013 American Housing Survey.
Although rentals in smaller structures with 2–4 units have also remained
a key source of low-cost housing, they are also at higher risk of loss. In
addition to their age, units in smaller multifamily buildings are more
vulnerable to being removed from the affordable stock because they tend to be owned
by “mom and pop” investors—typically an individual or couple—who have narrow
operating margins due to high property taxes, heavy debt loads and inadequate
cash flow. As this 2009 Federal Reserve Bank of Boston report notes, many
of these mom and pop landlords hold other jobs that account for most of their
earned income and are less likely than owners of much larger buildings—a group
that is often comprised of partnerships, real estate investment trusts or
corporations— to make an operating profit from their buildings.
A number of barriers exist to developing rental housing at a
price point ($875) that the typical renter can afford. At the local level,
developers may be faced with land-use regulations that restrict the area available
to build multifamily housing as well as the number of units in these
developments. These limitations can result in higher per-unit construction
costs that are also passed down to tenants in the form of higher rents.
What can be done in order to build housing that low- and
moderate-income households can afford, including units near transit-accessible,
amenity-rich locations? A recent Urban Land Institute report has suggested
that local governments offer publicly owned land at reduced or no cost to
developers in high-cost metros such as Washington, D.C., and co-locate
affordable housing developments with new public facilities such as libraries or
community centers. Local inclusionary housing programs
can also facilitate the development of affordable new units, but the amount of
affordable housing developed through these programs is small relative to the volume
produced through federal subsidy programs like the Low Income Housing Tax
Credit (LIHTC) program and HOME. In a 2010 report, the Innovative
Housing Institute surveyed 50 inclusionary programs across the U.S. and estimated
that they had produced more than 80,000 units since adoption. In contrast, over
2 million affordable rentals have been developed through the LIHTC program and 463,000 units through the
HOME program to date.
Last month, Congress approved an appropriation of $950 million in
funding for HOME in FY 2016, $50 million above the FY 2015 enacted level. Although
this boost in funding represents a dramatic reversal from previous House and
Senate proposals that had called for steeper cuts to HOME, the FY 2016
appropriation is still 56 percent below the FY 2006 level. Indeed, the strained
fiscal climate may continue limit the availability of subsidies that make it
economically feasible for both for-profit and nonprofit developers to build affordable
rental housing.
No comments:
Post a Comment