Tuesday, January 31, 2017

How are Community Development Organizations Helping Build Healthy Places?

by Alina Schnake-Mahl
Gramlich Fellow
The great majority of America’s high-performing community development organizations (CDOs) are actively tackling health challenges in their communities. In a new working paper* published by NeighborWorks® America and the Joint Center for Housing Studies, Sarah Norman (NeighborWorks’ Director of Healthy Homes & Communities) and I examine how CDOs engaged in activities at the nexus of health, housing and community development. 

Drawing on a survey of the 242 high-performing CDOs in the NeighborWorks network, we found that 89 percent of the surveyed organizations reported activities and strategies that explicitly promoted health in 2015 – from green and healthy building standards to on-site, coordinated health services. We also found that 83.3 percent of organizations worked with partners to support their efforts.  Increases in these activities, we noted, have been spurred by recent changes in the American health-care system and philanthropic grantmaking that together have provided new opportunities for CDOs to partner with other community entities to address health challenges.

CDOs used a variety of approaches, many of them focused on healthy homes and access to healthy food. For example, Foundation Communities, a nonprofit affordable housing provider based in north Texas since 1990, addresses the health and social needs of residents through health and wellness classes; smoke-free, green and healthy rental homes; community gardens and walking paths; as well as childcare and after school programming that addresses literacy and physical fitness. An evaluation of these programs showed improvements on measures of quality of life and well-being for program participants.


Photo courtesy of Foundation Communities

Similarly, REACH CDC – an affordable housing developer and property management company serving Portland, Oregon – is a member of a Limited Liability Corporation (LLC) that provides enhanced health and social service coordination for 1,400 residents at 11 federally subsidized, independent-living, affordable-housing properties in Portland. Project elements include an on-site Federally Qualified Health Center; culturally specific services for non-English-speaking residents; food distribution for homebound residents and other residents experiencing food insecurity; health navigators; and free mental health consultations. Multiple evaluations documented improvements in quality of life and well-being for residents as well as cost savings for Medicaid

Taken as a whole, the study shows that CDOs have undertaken significant efforts to explicitly improve the health of the communities they serve. Additionally, as the health care system increasingly targets the social determinants of health, there are new opportunities for engagement.  For example, housing-based services could help address gaps between formal medical care and community health to help older residents to age in their communities. More broadly, CDOs’ long-standing relationships with local communities provide a strong base to support cross-sector partnerships to tackle health inequities.

Alina Schnake-Mahl is a doctoral student in the Department of Social and Behavioral Sciences, at the Harvard T.H. Chan School of Public Health.  She was a 2016 recipient of the The Edward M. Gramlich Fellowship in Communityand Economic Development, which is co-sponsored by the Joint Center and NeighborWorks®America.

*The full article is under consideration in Cities & Health; the journal is available online. 

Wednesday, January 25, 2017

Four Challenges to Aging in Place

by Jennifer Molinsky
Senior Research Associate
Within 20 years, one in five Americans—almost 80 million people—will be older than 65 and, surveys indicate, they will want to remain in the current homes for as long as possible. However, the country currently lacks the accessible housing units and supportive social services needed to accommodate these desires.

Four challenges are particularly noteworthy, according to Projections and Implications for Housing a Growing Older Population, a recent Joint Center report which also projected that the share of households headed by someone over 65 will grow from 29.9 million today to 50 million in 2035. In particular:
  • Most U.S. homes are not accessible for older people with limited mobility
  • Many older Americans living at home will need long-term care, which is expensive
  • Millions of older adults cannot afford their current housing units
  • Older adults who live at home are often isolated

Challenge #1: Making Housing Accessible


A growing older population will mean greater numbers of households that include someone with a disability (Figure 1). Indeed, the Joint Center projects that by 2035, 17 million older households will include at least one person with a mobility disability for whom stairs, traditional bathroom layouts, and narrow doors and corridors may pose challenges, a 77 percent increase from today. Yet only 3.5 percent of US housing units offer a zero-step entrance into the home, single-floor living, and wide doorways and hallways that accommodate someone in a wheelchair.

 Click to enlarge
Notes: Mobility disability is defined as difficulty walking, getting in and out of bed, and climbing one flight of stairs; self-care disability as difficulty eating, dressing, toileting, and bathing; and household activity disability as difficulty with meal preparation, food shopping, using the telephone, taking medication, money management, housework, and driving.
Source: JCHS tabulations of University of Michigan, 2014 Health and Retirement Survey.


The costs of improving safety and accessibility range from free (e.g. removing throw rugs) to costly (e.g. a new addition to enable single-floor living). Preparing ahead, at a time when the no one in the household has limited mobility disabilities, can help lower the financial and emotional cost of these changes—for example, during a bathroom remodel, adding reinforced walls can make the later addition of grab bars much simpler, while choosing a walk-in shower can eliminate the need to add one later. For some, merely identifying modification needs and finding a contractor or handyman to make changes can be daunting. Consequently, resources that can connect people to trustworthy sources to assess the home and find capable workers will be an important part of any efforts to support aging in place.

However, a sizeable share of homeowners will need financial assistance to make these changes. Today nearly 10 percent of all older homeowner households have less than $50,000 in total assets including the value of their homes. (Excluding the value of the home, 39 percent have less than $50,000.) Going forward, trends in income, wealth, and debt suggest that older adults may have even fewer assets in the future. Helping older adults with limited means finance modifications through tax credits, low- or no-interest loans, grants, or expanded Medicaid waivers for needed modifications will be important.

Renters, particularly those living in older, less accessible units, may be in more difficult straits. Even though federal law generally requires that landlords allow tenants with disabilities to make necessary changes to their units, renters—whose median wealth is only $6,000—typically must do so at their own expense. Furthermore, landlords may require the modifications be removed at renters’ expense upon leaving.

Challenge #2: Providing Long-Term Care 

The Joint Center projects that the number of older adult households in which at least one person has a self-care disability will reach 12 million by 2035; many of these households will require daily assistance with personal care if they are to stay in their homes. (This is consistent with an often-cited 2005 study by Peter Kemper, Harriet L. Komisar and Lisa Alecxih estimating that nearly 70 percent of adults who reach the age of 65 will need some form of long-term care later in life.) Indeed, this type of care is increasingly being offered in people’s homes. Nursing home usage has declined in the past two decades, a trend likely to continue as health and housing partners build partnerships to deliver care at lower cost to private residences. In addition to assistance with personal care, by 2035, we project that 27 million older Americans will need help with other household tasks such as shopping, housework, or paying bills.

Yet long-term care currently is expensive. The median monthly cost for a home health aide working five days per week is $3,813. The typical older renter could afford just two months of these services before exhausting their savings. While the median older homeowner is better situated, many have limited resources—and as noted above may need these to make modifications to their homes.

Today most assistance is provided by family members, including spouses, at least in part because of high costs. However, in the future fewer family members will be available to the next generation of older adults, because the number of households with few or no children, as well as single-person households, will rise. For individuals, factoring in the potential costs of paying for in-home support and care is an important part of planning for aging in place, but policy has a role as well in encouraging innovation of cost-effective care delivery in the home.

Challenge #3: Ensuring that Housing is Affordable 

Affordability is and is likely to remain a significant obstacle to aging in place. In 2014, 31 percent of older households were cost-burdened (i.e. they spent more than 30 of their income on housing). Holding cost-burdened shares by age, race/ethnicity, and tenure constant, the Joint Center projects that by 2035, 17.1 million older households will be housing cost-burdened, and 8.5 million of these households will be spending more than 50 percent of their income on housing.

Given lower incomes, older renters are more likely to be cost-burdened. However, with a homeownership rate approaching 80 percent for older households, owners are more numerous and make up the majority of cost-burdened older households. In particular, owners who carry mortgages into older ages—a trend that has increased over the past 20 years—are at higher risk of experiencing unaffordable housing costs. Households that are housing cost-burdened typically cope by cutting back on other necessities, such as food, healthcare, or transportation. These tradeoffs put older adults’ health at risk and limit their opportunities to engage in their communities and access needed services.

For homeowners, the challenge of high housing costs might be met with prudent and early financial planning, reverse mortgages or refinancing, relief from property taxes, or help increasing home energy efficiency and lowering utility costs. Renters have fewer options, as rental subsidies are in short supply. By 2035 the Joint Center projects that the number of older adults eligible for rental housing subsidies will grow to 7.6 million from just under 4 million today. Currently the nation provides subsidies to only about one-third of those eligible; simply maintaining this level for seniors in 2035 would require providing subsidies to an additional 1.3 million households, which would more than double the number of older people who are being assisted today.

Challenge #4: Reducing Isolation

Ensuring older households are able to connect with their neighbors and access services in their communities and beyond is as critical to aging in place as preparing one’s home and finances. One can be isolated anywhere, even in a city if streets are perceived as unsafe, or if friends or needed services are not nearby. There are, however, ways to capitalize on a localized population of older adults to deliver services, through organizations like “villages” or those that serve naturally occurring retirement communities (NORCs), such as large apartment complexes that are home to significant numbers of older people.

Isolation is a particular concern for those aging in low-density and rural locales. The new study found that that just under half of older households are located in areas of metro regions with less than one housing unit per acre, or outside metro regions entirely (Figure 2). When older adults curtail or give up driving—a share that exceeds 50 percent for those in their mid-80s and above—people living in these locations can be particularly isolated.

 Click to enlarge
Notes: Areas are defined as census tracts. High-density metro areas have at least 2028 housing units per square mile; medium-density metro areas have between 644 and 2028 housing units per square mile; and low-density metro areas have less than 644 housing units per square mile. Connected and isolated non-metro areas are defined using USDA Rural-Urban Commuting Area codes.
Source: JCHS tabulations of 2010-2014 American Community Survey 5-Year Estimates and USDA Rural-Urban Commuting Area codes.


Alternative transportation, such as paratransit or car-share services, as well as technology that enables virtual medical appointments and social interaction, will be key. But individuals in these lower density areas, and the organizations and governments that serve them, will need to consider how to expand programs to ensure older adults can access services and remain engaged in their communities.

Moving Forward

These challenges do not mean that aging in place is an impractical or an unworthy goal, but rather that there is much planning to be done at both the individual and societal level. Educating households about the financial and physical challenges they might face if they remain in their current home and the options available to address them is an important first step. So is ensuring that local governments understand and plan for the challenges their older residents will likely face.

For some, though, alternatives to a current residence may prove to offer a higher quality of life. Therefore, we also need to create new housing options that offer accessibility features, are located near to shopping and services (or in a multifamily building that provides services), offer flexible space (perhaps including space that can be occupied by caregivers if needed), and are aimed at a people with range of incomes, including low-income renters. Developing housing with these features in the centers or downtowns of small towns and suburbs where older adults already live can provide alternatives that allow longtime residents to maintain ties to their communities. Since one in three US households will be headed by an older adult within 20 years (up from one in five today), we need to start taking these and other steps as soon as possible.

--
Jennifer Molinsky will be a panelist at our March 6 event Housing and Policy in an Aging America. This event will be free and open to the public.

Thursday, January 19, 2017

New Benchmark Data Modestly Lowers Remodeling Market Size Projections

by Abbe Will
Research Analyst
The Joint Center’s Leading Indicator of Remodeling Activity (LIRA) provides a short-term outlook of national home improvement and repair spending to owner-occupied homes and is benchmarked to national spending estimates from the Department of Housing and Urban Development’s American Housing Survey (AHS). The latest LIRA release projects national spending for home remodeling and repairs will grow to $317 billion in 2017, an increase of 6.7 percent from last year. This LIRA release also updates and revises historical spending levels and growth due to the incorporation of newly released historical benchmark data from the 2015 AHS. Compared to last quarter’s LIRA release, the updated LIRA now shows lower and less cyclical growth in homeowner improvement and repair spending in 2014 and 2015, a somewhat lower market size estimate, and also more modest projections for remodeling market growth in 2017. According to Joint Center tabulations of the AHS, spending in 2014 and 2015 was not quite as robust as the LIRA model predicted, growing 11.3 percent from $250 billion in 2013 to $278 billion in 2015 compared to LIRA estimated growth of 14.3 percent over this time period. As seen in Figure 1, the lower growth in remodeling spending in 2014 and 2015 has implications for the size of the market projected by the LIRA model for 2016 and 2017.

Notes: Data for 2014 and 2015 are based on estimates from the 2015 American Housing Survey. Data since 2016 are modeled by the LIRA. Source: Joint Center for Housing Studies.

Previously, the LIRA estimated a homeowner improvement and repair market size of $305 billion in 2016 and projected spending growing to $326 billion by the third quarter of this year. Now with the replacement of AHS-based benchmark data for previously modeled benchmark estimates, the LIRA model indicates remodeling activity reached $297 billion in 2016 and projects spending will reach $317 billion this year. The implication of slightly slower growth in actual remodeling and repair spending is a reduction in market size projections for 2017 of 2.9 percent or $9.5 billion. Incidentally, the more modest growth projected by the LIRA for 2017 compared to the prior release is not related to the addition of the new historical benchmark data. The LIRA projections revise routinely as the year-over-year trends in the LIRA inputs are updated or revised.

The weighted average of the LIRA inputs produces the LIRA estimates and projections as seen in Figure 2A (for modeling improvements spending trends) and Figure 2B (for modeling maintenance and repair spending trends) compared to the now updated AHS-based benchmark data series for 1994-2015. The improvements LIRA continued to track the reference series very closely in 2014 and 2015. The estimates produced by the improvements LIRA model and the AHS-based benchmark now have a correlation coefficient of 0.84 (p-value of 0.00). And a simple regression of the LIRA output on the benchmark spending series results in an R-squared value of 0.6759, which suggests that upwards of 70% of the variation, or movement, in the improvements spending benchmark can be explained by the LIRA model.

Sources: JCHS calculations using HUD, American Housing Surveys; Department of Commerce, Retail Sales of Building Materials; and US Census Bureau, Construction Spending Value Put in Place (C-30); Leading Indicator of Remodeling Activity.

Similarly, Figure 2B compares the weighted average output of the maintenance and repair LIRA model to its AHS-based reference series. The maintenance LIRA has also tracked its benchmark fairly well since 2013. The maintenance and repair LIRA and its reference series have a correlation coefficient of 0.73 (p-value of 0.00) and a simple regression of the LIRA output on the benchmark results in an R-squared value of 0.5362, which suggests that about 54% of the movement in the home maintenance and repair spending benchmark can be explained by this LIRA model.

Sources: JCHS calculations using HUD, American Housing Surveys; Department of Commerce, Retail Sales of Building Materials; and US Census Bureau, Survey of Residential Alterations and Repairs (C-50); Leading Indicator of Remodeling Activity.

Last spring, the LIRA was re-benchmarked to a measure of home improvement and repair spending based on estimates from HUD’s biennial American Housing Survey, and at that time, historical remodeling and repair data from the AHS was available for 1994–2013. Until the 2015 AHS data became available, the LIRA model was used to estimate historical improvement and repair spending levels since 2013. Once every two years, with new historical AHS data, the LIRA benchmark series will be updated. With the January 2017 release, the LIRA model will be used to estimate historical spending levels since 2015 until the next biennial release of the American Housing Survey allows for actual 2016 and 2017 spending data to replace modeled estimates.

More information and analysis of recent and expected trends in home improvement and repair activity will be forthcoming in the Joint Center for Housing Studies’ latest biennial Improving America’s Housing report to be released on Tuesday, February 28th.

Wednesday, January 11, 2017

The Case for Allowing Tenants and Owners to Remain in Their Homes Post-Foreclosure

by Rachel Bratt
Senior Research Fellow
Although federal guidelines allow foreclosed homes to be sold with occupants, in a recently published article in Housing Policy Debate, I report that the guidelines are largely irrelevant in practice. In fact, data obtained from HUD through a Freedom of Information Act request shows that in Fiscal Years 2010-2014, there were a total of 23,746 requests for FHA-insured foreclosed properties to be conveyed while occupied. However, only 87 of those requests—much less than one percent—were approved by the U.S. Department of Housing and Urban Development (HUD) and the Federal Housing Administration (FHA), which is part of HUD.

The data—along with interviews done with key stakeholders in Greater Boston—raise troubling questions about the extent to which HUD/FHA as well as the Federal Housing Finance Agency (FHFA) and housing-related Government Sponsored Enterprises (GSEs)—specifically, Fannie Mae and Freddie Mac—are continuing to view foreclosed homes more as financial assets, whose value they seek to maximize by requiring that they be vacant when they are sold. In doing so, they ignore the fact that the buildings also are dwellings for financially strained households who, if evicted, may need additional housing subsidies as well as the fact that continued occupancy by prior owners and tenants can be part of an effective strategy to preemptively stabilize neighborhoods. 


While there have been some changes in an FHFA policy that could soften the GSEs’ “no occupants at conveyance” practice, it is not yet clear whether this will result in former owners and tenants being allowed to remain in their homes following foreclosure. More generally, several other recent policies pertaining both to the GSEs and to HUD/FHA provide reasons for optimism. However, the extent to which these translate into pro-consumer and pro-neighborhood practices is not yet known.

To enable former homeowners and tenants to continue living in their homes following a foreclosure, greater public resources and commitment are needed. Programs and financial assistance that would enable nonprofits to purchase foreclosed dwellings, then rent them back to the prior owners and tenants, and to successive low-income households, would result in a long-term source of affordable housing. Key to such a policy shift would be more detailed assessments of the ways in which HUD, FHA, FHFA and the GSEs approach their pre- and post-foreclosure mortgage relief and property disposition policies, and the various costs involved in allowing occupied conveyance vs. requiring forced displacement. It seems likely that when vulnerable, low-income households are facing the loss of their homes, other units of government may need to step in to help them find and pay for their new housing.

The long-term costs under this scenario—both financial and otherwise—are virtually certain to far outweigh a short-term, up-front investment in keeping these households in place. Absent these changes, the various agencies will continue to implement a highly problematic set of procedures that promote family instability, potentially increase homelessness, and result in vacant homes, which have adverse neighborhood impacts.

Rachel Bratt is a Senior Research Fellow of the Joint Center for Housing Studies at Harvard, and Professor Emerita, Department of Urban and Environmental Policy and Planning, at Tufts University.

Friday, January 6, 2017

Homeownership Rates for Children of Immigrants—Age Matters

by George Masnick
Senior Research Fellow
Analyses of data used in a recent Census Bureau report show that homeownership rates for younger adult children of immigrants are substantially higher than rates for immigrants in the same age cohorts. In addition, while homeownership rates for native-born residents with native-born parents under age 45 are higher than those for the children of immigrants, members of the latter group quickly make up this deficit after the age of 45.

These findings emerge from additional analyses of data used in a first-ever report on the characteristics of three generations of US residents by nativity that was released late last month by the Census Bureau. The report is the first to use a unique question in the Current Population Survey‘s Annual Social and Economic Supplement (CPS/ASEC) asking the birthplace of both the respondent and the respondent’s parents. This allows one to identify people born abroad (1st generation), native-born children of at least one immigrant parent (2nd generation), and those whose parents were both born in the United States (3rd-and-higher generations).

The Census report discusses differences among the three groups in such areas as age, education, labor force participation, income, poverty, occupation, and homeownership. The last section is particularly interesting because other Census Bureau data the Joint Center has used to study homeownership, such as the Decennial Census, the American Community Survey, and the American Housing Survey, do not ask respondents where their parents were born. Moreover, as I have shown in an earlier post that also used CPS/ASEC data, immigrants are an important part of a recovering housing market. Foreign-born people have accounted for about one-third of all net household formations over the past two decades, and slightly under 30 percent of all gains in owner-occupied housing. Fully half of all household growth between 1994 and 2014 by under-30-year-olds came from 2nd generation children of immigrants, and another 35 percent from immigrants themselves.

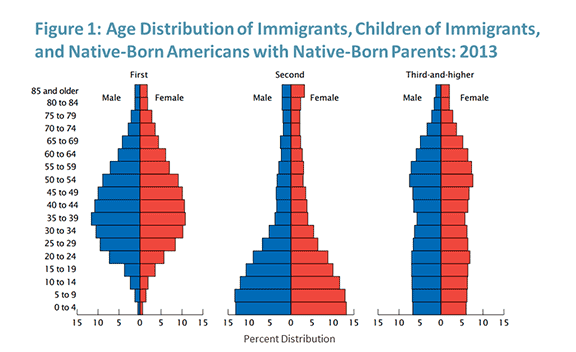
The Census Bureau report notes that incomes and homeownership rise sharply between the 1st and 2nd generations but tend to level off for the 3rd-and-higher-generations. However, these findings may obscure significant differences between the 2nd and 3rd-plus generations because, as other parts of the Census Bureau report note, the generations have dramatically different age distributions. In particular, the majority of immigrants are middle-aged, and their children are 20 or younger. Adult children of immigrants have their largest percentages in the under-30 age group. Baby boomers dominate the 3rd-and-higher generations at age 50-70 in 2013 (Figure 1).

 click to enlarge
Source: U.S. Census Bureau, Characteristics of the U.S. Population by Generational Status: 2013, Current Population Survey Reports, Nov. 2016, Figure 9.

Because of these differences in age structure, it is impossible to compare the three generations broadly on any variable that varies with age, such as income or homeownership. For example, as the Census report shows, the median income among all individuals age 15 and over rises dramatically from $36,669 for the 1st generation to $46,764 for the 2nd generation. But, at $46,795, it is virtually unchanged for the 3rd-and-higher generations. However, when the data are broken down by age groups, they tell a somewhat different story. The Census report, which looks at median personal income for four broad age groups, shows significant income advantages for the 2nd generation over the 3rd-and-higher generations for 25-44, 45-64, and 65+ year olds. When median household income (a more relevant definition of income with respect to homeownership) is broken down into 5-year age groups, the 2nd generation can be seen to earn significantly more than their parent’s generation at every age, and importantly, more than the 3rd-and higher-generations as well (Figure 2).

 click to enlarge
Source: Joint Center for Housing Studies tabulation of 2015 CPS/ASEC data.

The need to control for age is especially important when examining generational differences in homeownership. In four of the five household family types discussed in the Census report, when age is not controlled, 2nd generation homeownership rates are lower than those for the 3rd-and-higher generations (and in the fifth, the difference between the groups is quite small) (Figure 3).

 click to enlarge
Source: U.S. Census Bureau, Characteristics of the U.S. Population by Generational Status: 2013, Current Population Survey Reports, Nov. 2016, Fig. 28.

If we control for age, would 2nd generation homeownership rates still be lower than those for the 3rd-and-higher generations? Also, since the Census report examined generational differences for a single year (2013), if there are differences by age, how well have they held up over time?

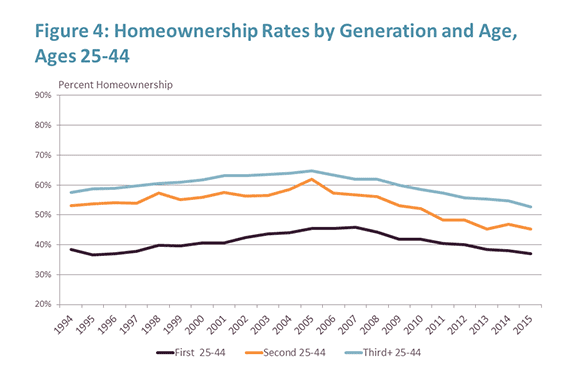
To answer these questions, we examined homeownership rates by age by 5-year age groups for the three generations for each year 1994-2015. These tabulations first can be summarized by examining the trends for two broad age groups (Figures 4 and 5). For households age 25-44, 2nd generation homeownership rates are well above those of their parents’ generation but below those of the later generations. This last pattern is partly explained by the greater concentration of younger 25-34 year olds in the broader 25-44 age group for the 2nd generation, and probably also due to the greater concentration of immigrants and their children in locations that have below average homeownership rates, such as the Los Angeles, San Francisco, New York City, Boston, and Chicago metropolitan areas. There might also be a greater ability of 3rd-and-higher generation parents to help their children financially in buying their first home, and a corresponding need for children of immigrants to save longer for a downpayment.

 click to enlarge
Source: Joint Center for Housing Studies tabulations of 1994 through 2015 CPS/ASEC data.

 click to enlarge
Source: Joint Center for Housing Studies tabulations of 1994 through 2015 CPS/ASEC data.

This analysis also shows that among younger adults the gap between the homeownership rates of the 2nd and 3rd-and-higher generations has widened since the Great Recession. The growing gap might be due to compositional shifts within the broad 20-year age cohort in such factors as age, ethnic composition, household composition and income. Alternatively, tightening credit markets might affect the generations differently. This could be particularly important for undocumented members of the 2nd generation. In any case, both the generational gap for younger adults and their recent trend certainly deserve further investigation.

For the broad adult age group over age 45, the story is quite different. Among older adults, the homeownership rates among the 2nd and 3rd-and-higher generations have been essentially equal for the past two decades except for a few years at the height of the Great Recession. The slower entry into homeownership we noted for younger 2nd generation households appears to have simply reflected the timing of the transition from renting to owning, rather than the effects of any structural differences between these two generations. After age 45, the 2nd generation has consistently closed the gap with the 3rd-and-higher over the past two decades. Another way to look at this homeownership data is to follow different birth cohorts of young adults as they age from the 25-44 age group into the 45-64 group. For each of the five-year 2nd generation cohorts under age 45 in 1995, the homeownership rates are lower than the respective cohorts in the 3rd-and-higher-generations. However, by 2015, when each of these cohorts is 20 years older, the homeownership gap between the generations has been completely eliminated (Figures 6 and 7).

 click to enlarge
Source: Joint Center for Housing Studies tabulations of 1995 CPS/ASEC data.

 click to enlarge
Source: Joint Center for Housing Studies tabulations of 1995 CPS/ASEC data.

The higher median income of 2nd generation adults above age 45 perhaps provides just the leverage they needed to make up the lost ground. And it is also likely that the older 2nd generation households are more concentrated in locations that have lower homeownership rates than the national average. If we could control for metropolitan location as well, middle-aged 2nd generation age-specific homeownership might well be higher than for the 3rd-and-higher generations. Unfortunately, the CPS/ASEC sample size does not allow such sub-national trends to be observed.

In sum, it is important to underscore that failing to recognize the important age differences between the three generations can lead to erroneous conclusions about levels and trends in income and homeownership. Because the 2nd generation age structure is so young, comparisons that lump adults of all ages together will result in unduly low incomes and homeownership for this group. As the Census report concludes, most 2nd generation U.S. residents surpass their parents’ generation in many measures, particularly education, income and homeownership. Once proper age controls are introduced, they equal or surpass the 3rd-and-higher generations in these dimensions as well.

Tuesday, January 3, 2017

Projection: US Will Add 25 Million Households by 2035

by Dan McCue
Senior Research Associate
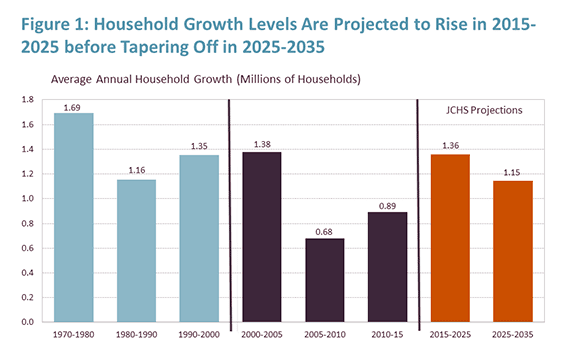
The United States will add 13.6 million households between 2015 and 2025 and another 11.5 million households between 2025 and 2035, according to Updated Household Projections, 2015-2035: Methodology and Results, a new Joint Center working paper. This growth represents an increase from the past decade that is in line with historic rates of growth seen in the 1990s, but still well below the levels experienced in the 1970s (Figure 1). An addendum to the paper indicates that the projected growth in households could lead to continued growth in residential construction activity.

 Click to enlarge
Sources: JCHS Tabulations of US Census Bureau, Housing Vacancy Surveys, Decennial Censuses, and 2016 JCHS Household Projections  

The new household projections incorporate newer population projections from the US Census Bureau that are substantially larger than the Bureau’s 2012 population projections used in our 2013 estimates of household growth, which projected that the U.S. would add 12.4 million households between 2015 and 2025 and 10.35 million households between 2025 and 2035. Our new household projections also make methodological changes related to headship rates—the ratio of households to people—designed to reflect the fact that shifts in headship rates have significantly impacted household growth over the past decade. (As the paper discusses in more detail, rather than continuing the Joint Center's recent practice of holding current headship rates constant, the new estimates use trended headship rates.)

While both changes are significant, the increases from our 2013 household projections are due entirely to the new Census Bureau population projections. In contrast, the methodological changes produce slightly lower projected growth than our previous methodology. However, the methodological changes do affect the distribution of household growth by age, race and ethnicity. In particular, they increase household growth among the oldest age groups and also among non-Hispanic whites between 2015 and 2025. In contrast, they reduce growth among 25-44 year olds as well as from black and Hispanic households.

Despite these shifts, millennials and minority households are still projected to be the main drivers of household growth in coming decades. Indeed, millennials under age of 30 in 2015 are projected to form 23 million net new households between 2015 and 2025, while 72 percent of household growth overall is expected to be non-white households. At the same time, aging of the baby boom generation will bring the number of senior households up to unprecedented heights (Figure 2). Together these forces will reshape housing demand over the next two decades.

 Click to enlarge
Source: 2016 JCHS Household Projections

In addition to the estimates on household growth, the working paper includes an addendum with baseline estimates for the amount of new residential construction that might be needed to accommodate future household growth, as well as the demand for replacement units, second homes, and other changes. Combined, these factors suggest that the baseline demand for new housing units between 2015 and 2025 will range from 16.0 to 18.2 million units. While this estimate is well above most recent rates of new unit completions and mobile home placements, it is consistent with historic averages for past 10-year periods (Figure 3). Although the analysis does not factor in estimates of over- or under- supply, the estimates do suggest underlying demand will support higher construction levels and that the growth in residential construction seen over the past five years is likely to continue.

 Click to enlarge
Source: JCHS Tabulations of US Census Bureau, New Residential Construction data