Showing posts with label metros. Show all posts

Tuesday, July 11, 2017

The Rise of Poverty in Suburban and Outlying Areas

by Elizabeth La Jeunesse
Research Analyst
A key takeaway from our latest State of the Nation’s Housing report is that poverty is both increasing and becoming more concentrated across the country. Moreover, while a third of the poor live in high-density urban neighborhoods, the number of poor people and poor neighborhoods grew particularly rapidly in the “exurbs,” low-density neighborhoods on the fringe of the nation’s metro areas (Figures 1 and 2).


Figure 1. The Number of People Living in Poverty Has Increased Most in Suburban and Exurban Communities

Figure 2. Much of the Growth in High-Poverty Neighborhoods Has Been in Suburban and Outlying Areas


According to the report, from 2000 to 2015, the number of people living below the federal poverty line rose by 41 percent, from about 33.8 million to 47.7 million. Additionally, the number of high-poverty neighborhoods (census tracts where the poverty rate is 20 percent or more) rose by 59 percent, and the poor population living in these areas increased by 76 percent to 25.4 million. As a result, 54 percent of the nation’s poor now live in high-poverty neighborhoods, up from 43 percent in 2000.

The growth in high-poverty neighborhoods was widespread, occurring in all but three of the nation’s largest 100 metros (Honolulu, El Paso, and McAllen, TX). Moreover, the rise of poverty was particularly rapid in the exurbs, where the number of high-poverty neighborhoods more than doubled between 2000 and 2015, and the number of poor people living in these neighborhoods grew by 164 percent, rising from 1.5 million in 2000 to 3.9 million in 2015. Such growth presumably was due to the fact that housing generally is less expensive in these areas, but the savings in housing costs are often offset by higher transportation costs and more time spent travelling to work and other activities.

Our new interactive chart shows that these changes were not uniform in the nation’s 100 largest metropolitan areas. To begin with, two-thirds of these metros underwent a rise in concentrated exurban poverty from 2000-2015. Moreover, the magnitude of the increase varied. For example, the number of high-poverty, exurban tracts increased more than tenfold in the Detroit, Greensboro, and Cape Coral, FL metros, and increased by a factor of five or more in 11 other metros, including Atlanta, Denver, Charlotte, Cincinnati, Kansas City, Las Vegas, Nashville and Orlando. Other large metros where the number of high-poverty, exurban neighborhoods more than tripled included Baltimore, Philadelphia, Pittsburgh, Portland, St. Louis, and Tampa.

For example, in the Atlanta metro, the number of low-density, high-poverty, exurban tracts rose from only 11 in 2000 to 72 in 2015 (Figure 3). Meanwhile, in the St. Louis metro, there were 28 high-poverty, exurban neighborhoods in 2015, up from 8 such areas just 15 years earlier (Figure 4).

Figure 3. Atlanta


Figure 4. St. Louis


While poverty remains highly concentrated in dense urban areas, several large metros now have unusually large shares of high-poverty, exurban neighborhoods. In the Atlanta, Charlotte, and Nashville metro areas, for example, nearly a quarter or more of all high-poverty neighborhoods are located in low-density, exurban areas. Poverty’s shift to lower-density areas was especially pronounced in the Charlotte area, where 41 percent of high-poverty tracts are now situated in low-density, exurban areas, up from just 15 percent in 2000 (Figure 5).

Figure 5. Charlotte, NC


Moreover, in several smaller metros across the South – such as Columbia, SC; McAllen, TX; Greenville, SC; Jackson, MS, and Knoxville, TN – well over half of all high-poverty neighborhoods are located in low-density, outlying regions (Figure 6).

Figure 6. McAllen, TX 


Use our interactive tool to see the change in high-poverty neighborhoods in the nation’s 100 largest metro areas between 2000 and 2015.

Download Excel files for additional data on high-poverty neighborhoods. (W-1 and W-15)

Download Chapter 3 of our State of theNation’s Housing 2017 report, which contains additional discussions on the growth of poverty and the spread of high-poverty neighborhoods.

Thursday, July 6, 2017

Are Home Prices Really Above Their Pre-Recession Peak?


by Alexander Hermann
Research Assistant
In 2016, national home prices not only rose for the fifth year in a row, they finally surpassed their pre-recession peak in nominal dollars, according to most national measures of home prices. However, as our new State of the Nation’s Housing report notes, when adjusted for inflation, home prices were still 9 to 16 percent below peak, depending on the measure used (Figure 1).


Figure 1. National Home Prices Now Exceed Their Previous Peak in Nominal Terms, But Not in Real Dollars


Note: Prices are adjusted for inflation using the CPI-U for All Items less shelter.
Source: JCHS tabulations of S&P CoreLogic Case-Shiller Home Price Index data.

Moreover, as our interactive maps show, changes in home price vary widely across the country and often exhibit strong regional patterns (Figure 2).

Figure 2. How Much Have Home Prices Changed?


Our interactive maps give users the ability to view price changes in 951 markets across the country over two time periods—since 2000 and since each area’s mid-2000 peak. Viewable markets include 371 Metropolitan Statistical Areas and 31 Metropolitan Divisions (derived from 11 additional metro areas), which together contain about 85 percent of that nation’s population, as well as 549 smaller Micropolitan Statistical Areas, which are home to another nine percent of the population.

The data indicate that nominal home prices were above their mid-2000s heights in 48 percent of all markets (454 total). These markets were largely concentrated in the middle of the country, the Pacific Northwest, and Texas.

However, in real dollars, prices reached their peaks in only 138 (15 percent) of all markets. Furthermore, while prices were above peak in only 10 percent of Metropolitan Statistical Areas and Metropolitan Divisions, they topped their peak in 17 percent of the smaller micro areas, which experienced less home price volatility over the last decade.

In contrast, real prices were still 20 percent below peak in about one-third of all markets, most located in areas hardest hit by the housing crisis, including Florida and large parts of the Southwest, Northeast, and parts of the Midwest.

There were notable differences in long-term patterns in areas where real prices remained well below their pre-recession peak. In many markets on both coasts—such as Miami, Washington, DC, and Sacramento—prices have risen significantly over the last several years and, in real terms, are now well above their levels in 2000. However, because prices in these areas rose significantly during the boom years and fell so sharply during the recession, the recent gains have left prices far below what they were in the mid-2000s.

In contrast, in some Midwestern and Southern markets—such as Detroit, Chicago, and Montgomery, Alabama—prices rose only modestly in the 2000s, dropped significantly during the recession, and have grown only slightly in recent years. Consequently, real prices in these areas were not only well below their peak levels from the mid-2000s, but remained below 2000 levels in many cases.

The uneven growth in home prices over the past two decades has led to increasing differences in housing costs. Illustratively, in 2000 the inflation-adjusted median home value in the 10 most expensive metros (of the country’s 100 largest metros) was about $350,000, about three times higher than the median value of homes in the 10 least expensive metros. But between January 2000 and December 2016, real home values in the ten highest-cost housing markets rose by 64 percent to about $574,000, more than five times the value of homes in the least expensive areas, which grew by only 3 percent, to $113,000.

A broader look at home prices further highlights these stark disparities. Nationally, real home prices rose 32 percent between 2000 and 2016. But home prices in 30 percent of markets (290 total) actually declined in real terms, including 28 percent of metro and 33 percent of micro areas, most of them in the Midwest and South. In the Detroit metro area, home prices declined 26 percent, the largest decrease among large metros. Prices also fell significantly in the Cleveland (22 percent decline), Memphis (15 percent decline), and Indianapolis (13 percent decline) markets.

At the opposite end of the spectrum, between 2000 and 2016 real median home prices rose by more than 40 percent in 153 markets (16 percent), most of them on the East and West Coasts. In fact, prices doubled in twelve markets, including the Honolulu metro areas, which saw 104 percent growth. Home prices also rose considerably in the Los Angeles (97 percent), San Francisco (84 percent), Miami (73 percent), and Washington, DC (62 percent) markets. While micro areas were more likely to be past their previous peak, the lower price volatility also meant they experienced less price growth since 2000, with only 12 percent of micros exceeding 40 percent growth.

Wednesday, March 15, 2017

Remodeling Activity Projected to Grow in Most Metropolitan Areas

by Elizabeth La Jeunesse
Research Analyst
Spending on home improvements is expected to increase this year in 43 of the nation’s 50 largest metropolitan areas, according to our latest report about the home improvement industry, Demographic Change and the Remodeling Outlook. The report projects that, on average, home improvement spending in 2017 in these metro areas will be 6.8 percent higher than it was in 2016, slightly more than the projected 6.1 increase nationwide. 

However, as an interactive map released in conjunction with the report shows, the growth rates will vary widely. About a third of major metro areas are expected to see strong growth of 10 percent or more, while a similar number should see declines or slow growth of under 3 percent.


Some of the largest increases, in percentage terms, are expected to occur in several Midwestern metropolitan areas such as Cincinnati, Cleveland, Columbus, Kansas City, Minneapolis, and Milwaukee, where there is a consistent demand for housing and prices are not as high as in other parts of the country.

Double-digit gains in home improvement expenditures are also expected in New England’s three largest metro areas—Boston, Hartford, and Providence—where home sales have been strong. While average per-owner spending in other metropolitan areas on the East Coast has been relatively high in recent years, total spending in several of those areas is expected to increase slowly in the next year. The report projects that spending will grow by less than one percent in New York, the nation’s largest metro area, and by less than four percent in the Washington, DC area.

Home improvement spending is also expected to pick up significantly in several fast-growing, Southern metropolitan areas where homebuilding activity has revived and more households are forming, such as Atlanta, Charlotte, Jacksonville, and Orlando. In contrast, spending will grow modestly or may even decline in Southern metro areas with oil-dependent economies such as Dallas, Houston, and Oklahoma City.

On the West Coast, the report projects a significant increase in spending on home improvements in the Sacramento metro area, where house prices recovered more slowly from the Great Recession than in other parts of the state. In contrast, spending is expected to increase only modestly or decline slightly in the Los Angeles, San Diego, San Francisco, and San Jose, where leading indicators suggest housing markets may be approaching their cyclical peaks. In metro areas across the Mountain and Pacific Northwest regions, growth rates are also expected to vary widely, from a low of just under 2 percent in the Las Vegas metro to a high of nearly 10 percent in the Salt Lake City area.

These projections are based on two measures of housing demand—single-family starts and growth in existing home sales—that are strong leading indicators of national remodeling activity. The results broadly support our expectation that home improvement expenditures in certain high-cost markets may soon reach a cyclical peak, while spending will increase in markets where house prices are lower but are increasing steadily.

The report also finds that the national market for home improvements is somewhat more concentrated in the nation’s 15 largest metropolitan areas, which account for about 29 percent of the nation’s homeowners. Illustratively, according to estimates from the 2015 American Housing Survey, average per-owner improvement spending in the same 15 metro areas was $3,500, or more than 30 percent greater than average spending by homeowners outside of these areas. As a result, aggregate spending by homeowners in the same 15 areas totaled over $80 billion, or nearly 37 percent of the total spending by all owners on home improvements nationally.

Tuesday, February 28, 2017

New Report: Aging Homeowners Drive Growth in Remodeling as Millennials Begin to Gain Footing

Homeowner spending on remodeling is expected to see healthy growth through 2025, according to Demographic Change and the Remodeling Outlook, the latest biennial report in our Improving America’s Housing series. Demographically based projections suggest that older owners will account for the majority of spending gains over the coming years as they adapt their homes to changing accessibility needs. Although slower to move into homeownership than previous generations, millennials are poised to enter the remodeling market in greater force, buying up older, more affordable homes in need of renovations.

The residential remodeling market includes spending on improvements and repairs by both homeowners and rental property owners, and reached an all-time high of $340 billion in 2015, surpassing the prior peak in 2007. [See our Interactive Infographic.] Spending by owners on improvements is expected to increase 2.0 percent per year on average through 2025 after adjusting for inflation, just below the pace of growth posted over the past two decades, and about on par with expected growth in the broader economy.

The large baby boom generation has led home improvement spending for the past twenty years, and its influence shows no signs of waning. Older homeowners will continue to dominate the remodeling market, as they make investments to age in place safely and comfortably. Expenditures by homeowners age 55 and over are expected to grow by nearly 33 percent by 2025, accounting for more than three-quarters of total gains over the decade. The share of market spending by homeowners age 55 and over is projected to reach 56 percent by 2025, up from only 31 percent in 2005.

Gen-Xers are now in their prime remodeling years, and while some are still recovering from home equity losses after the housing crash, many in this generation will undertake discretionary projects deferred during the downturn. And as younger households move into homeownership, they will supplement the already thriving improvement market.


Try the Interactive Infographic
“With national house prices rising sufficiently to help owners rebuild home equity lost during the downturn, and with both household incomes and existing home sales on the rise, we expect to see continued growth in the home improvement market,” says Kermit Baker, director of the Remodeling Futures Program at the Joint Center for Housing Studies.

Even though increasing house prices are encouraging homeowners to reinvest in their homes, they also are raising housing affordability concerns among younger buyers. Climbing mortgage interest rates and rising house prices not only make homeownership more difficult for younger households, but leave those who are able to buy with fewer resources to make improvements and repairs. And while high rents may provide an incentive to buy homes, they also make it difficult for first-time buyers to save for a downpayment.

Some demographic trends are also presenting challenges to a healthier remodeling market outlook. A disproportionate share of growth over the coming decade will be among older owners, minority owners, and households without young children; groups that traditionally spend less on home improvements.

“Despite these challenges, the remodeling industry should see numerous growth opportunities over the next decade,” says Chris Herbert, managing director of the Joint Center for Housing Studies. “Strong demand for rental housing has opened up that segment to a new wave of capital investment, and the shortage of affordable housing in much of the country makes the stock of older homes an attractive option for buyers willing to in invest in upgrades.”

Finally, as a new generation of homeowners enters the remodeling market, specialty niches focused on energy-efficiency, environmental sustainability, and healthy homes are likely to see significant growth. Home automation—encompassing everything from entertainment systems to home energy management, lighting, appliance control, and security—is also emerging as a strong growth market, particularly among younger households.

Looking ahead, there are several opportunities for further growth in the remodeling industry. The retiring baby boom generation is already boosting demand for accessibility improvements that will enable owners to remain safely in their homes as they age. Additionally, growing environmental awareness holds out promise that sustainable home improvements and energy-efficienct upgrades will continue to be among the fastest growing market segments.


Read the full report, try the Interactive Infographic, or join the conversation on Twitter with 
#HarvardRemodeling.

Monday, August 22, 2016

State and Local Governments Take Action to Promote Affordable Housing

by Daniel McCue
Senior Research
Associate
Home prices are rising, rents are up, and units available for rent or sale are few and far between. Detailing these trends, our 2016 State of the Nation’s Housing report once again finds affordability concerns at the top of the list of US housing challenges, both in metropolitan areas and rural counties. But with assistance reaching just 26 percent of households that qualify for it, the federal response has not been able to keep up with the growth in low-income households in need of affordable housing. Faced with this challenge, states and municipalities are increasingly looking beyond federal programs to take whatever action they can to increase the supply of affordable housing.

So what are they doing? In a recent article posted on the Shelterforce Rooflines blog I look at how state and local governments—those who are most commonly tasked with implementing federally funded programs—are increasingly working independent of federal programs and using their own resources to increase the supply of affordable housing in their areas.

Thursday, March 31, 2016

New Population Data from U.S. Census Reveals Increasing Migration to Sunnier Regions

Research Assistant
Last week, the U.S Census Bureau released new population estimates and its analysis of components of population change for counties and metro areas. This data includes total population estimates for July 1, 2015, total population change, changes in population due to natural increase, and domestic and international migration between July 1, 2014 and July 1, 2015.

We can see that domestic migration continues on a post-recession path of recovery and with it, long-term patterns of growth and movement to the Sunbelt, slowed by the downturn, are reappearing. Suburban counties in the South are once again attracting the most movers, while northern, largely Midwestern counties are experiencing the greatest population losses.

According to this latest release, the Houston, Dallas, Atlanta, Phoenix and New York metro areas rounded the top five for net population growth. In Texas, the metro areas of Houston and Dallas-Fort Worth saw population growth of 159,000 and 145,000 residents respectively over the past year. Two other metros in Texas—Austin-Round Rock and San Antonio—each grew by 50,000 people, putting them among the top growing metros in the nation. Collectively, these four metros added 412,000 in population. In all, Texas was home to 4 of top 16 metros in terms of population growth, in keeping with state-level data released late last year that showed Texas as the state with the most population growth followed by Florida, California, Georgia, and Washington. Among the top 100 metros, in percentage terms the Cape Coral-Fort Myers, FL Metro Area saw the highest population gain of 3.3%.

In all, 96 metros lost population over the past year. Among the top 100 metros, the biggest net population loss was in the Chicago area where the population dropped by 6,200, followed by Pittsburgh which lost 5,000 people.

The micropolitan areas saw a net growth of 27,000 with more than half (a total of 261) micro areas gaining population, four of which added more than 2000 people.

At the county level, population growth was also skewed to the south and west with the top 30 counties for total population growth being located in either the South or the West. The top three for net population gains were first Harris County, Texas and Maricopa County, Arizona, followed by Los Angeles County, California. Counties with the largest population losses were Cook County, Illinois which had a net negative population change of nearly 10,500, and Wayne County, Michigan, which had a net negative population change of nearly 6,700 people.

In percentage terms, among counties that had a total of more than 100,000 people in 2015, the top counties that gained the most population growth are in Texas, Hays county (5.2%) and Comal County (4.5%), while the counties that lost the most are San Juan County, NM (-4.2%) and Hardin County, KY (-1.8%). Though these counties with highest percentage losses are in the South and West, overall the counties with largest net losses were overwhelmingly in the Midwest and Northeast, and the ones with the biggest net gains were concentrated in the South.

In addition to overall gains and losses in population in metros and counties, the population estimates data also show components of growth in terms of net gains and losses from international immigration as well as domestic migration, which allow us to see what parts of the country are attracting people from around the country and those that are losing population moving to other areas.

As for domestic migration, top ten counties with highest net inflows were in the Sunbelt states of Arizona, Nevada, Florida and Texas. Maricopa County, Arizona saw the highest net domestic inflow, which was 48% of the net population change in the county. Clark County, Nevada saw the second highest net domestic inflow, which was 54% of the net population change in the county. Lee County, Florida moved up to the third spot from the ninth in 2014 for net domestic inflow, which was 92 % of the net population change in the county.

Los Angeles County, California followed by Cook County, Illinois saw the most net domestic outflow for the second year in a row.

In general, counties and metros that were attractive to domestic migrants also had high levels of international immigration. However, some counties that saw high international immigration, such as Los Angeles County, Miami-Dade County, and Queens County, also saw high domestic out migration. Indeed, in many areas gains from international immigration staved off potentially larger population losses due to domestic migration.

The map below shows the changes in population for each county between July 2014 and July 2015. Click on a county to display its data. Select a tab to map percent change in population, net international immigration or net domestic migration. [May take a few seconds to load. Click on the (i) in the upper right to reveal color key information.]


Detailed explanation of the census bureau methodology.

Socialize: http://arcg.is/1pYaNfM


Tuesday, January 5, 2016

Housing Cost Burdens Weigh Heavily on Low- and Moderate-Income Renters Across the Country


by Ellen Marya
Research Assistant
The Joint Center’s new report – America’s Rental Housing: Expanding Options for Diverse and Growing Demandhighlights the now familiar trend of increasing affordability pressures facing renter households. As of 2014, just under half (49.3) of renters were housing cost burdened, spending more than 30 percent of income on housing costs. This share includes more than one-quarter (26.4 percent) of renters who were severely cost burdened, spending more than half of their income on housing. The burden percentage rates remain near their peaks reached in 2011. In total, 21.3 million renters were cost burdened in 2014, 11.4 million severely so, both all-time high numbers.

Notes: Moderately (severely) cost-burdened households pay more than 30% and up to 50% (more than 50%) of income for housing. Households with zero or negative income are assumed to have severe burdens, while households paying no cash rent are assumed to be without burdens.

Source: JCHS tabulations of US Census Bureau, American Community Surveys.


Our interactive map series, released in conjunction with America’s Rental Housing, illustrates that renters across the country are experiencing housing cost burdens at high frequencies. In the nation’s 917 metropolitan and micropolitan statistical areas, the cost-burdened share of renters ranged from about one-quarter to nearly two-thirds in 2014, with between 40 and 50 percent of renter households housing cost burdened in the typical metro. Over half of renters were housing cost burdened in more than 200 metro and micro areas. Among these highly burdened localities are some of the nation’s largest metros, such as Miami, Los Angeles, New York, Philadelphia, and Atlanta. Also highly burdened were many smaller areas either with particularly high housing costs, such as Santa Cruz, Key West, Juneau, and Olympia, or with significantly lower incomes, such as Laredo, TX, Monroe, LA, Las Cruces, NM, and Flint, MI.


The link between low incomes and high cost burdens is evident across the country, and for those with the lowest incomes, housing cost burdens were nearly unavoidable. Among renters with household incomes under $15,000 per year – equivalent to full-time work at the federal minimum wage – just under 84 percent were housing cost burdened nationwide in 2014. Rates reached upwards of 90 percent in over 100 areas both large and small – Denver, Los Angeles, Dallas, Milwaukee, Walla Walla, WA, Sheboygan, WI, and Grand Forks, ND – and were above 50 percent for all but two small micro areas – Beatrice, NE and Ardmore, OK.


Even among middle-income renters with household incomes between $30,000 and $45,000, housing cost burdens are widespread. Nationwide, about half (48.4 percent) of households in this income group were cost burdened in 2014. Burdens for this group were especially high in several pockets across the country, typically in areas with especially high-cost housing. Upwards of 55-60 percent of moderate income renter households were cost burdened in metro and micro areas along both coasts, near major interior population centers such as Chicago and Atlanta, and in areas across Texas and northern Colorado.


These data show that, across the country, housing cost burdens are no longer a problem only faced by renters at the bottom rung of the income ladder. Indeed, their prevalence among moderate income renters is growing rapidly. Between 2001 and 2014, a time of strong growth in renting, the number of renter households with incomes between $30,000 and 45,000 increased by just over 13 percent. At the same time, the share of renters in this income group with housing cost burdens rose 11.5 percentage points from 36.9 to 48.4 percent, the largest jump among any income group. As a result, the number of moderate-income renter households with housing cost burdens increased by over 48 percent between 2001 and 2014. This dramatic rise underscores the growing affordability challenges facing America’s renters during a time of increasing demand for rental housing.

The dynamics of this demand, along with the supply response, market conditions, and policy challenges facing today’s renters, are explored in more detail throughout America’s Rental Housing.


Wednesday, December 2, 2015

CDFI Cluster Demonstration Project

Alexander Von Hoffman
Senior Research Fellow
In December 2013 the JPMorgan Chase Global Philanthropy Foundation issued a call for proposals for groups of Community Development Financial Institutions (CDFIs) to coordinate financial programs to alleviate problems facing low- and moderate-income communities, small businesses, and individuals. In January 2014 the foundation announced awards, totaling $33 million over a three-year period, to seven CDFI collaboratives. At the request of JPMorgan Chase Global Philanthropy, Alexander von Hoffman profiled the characteristics, objectives, methods, and achievements of each of the CDFI collaboratives in the first phases of their work. 

Purpose and Problems of CDFIs

In working- and lower-class neighborhoods in the United States, stability, let alone opportunity, is hard to come by. It can be difficult to get a loan on fair terms to buy a house or expand a business, particularly where African Americans, Hispanic Americans, and immigrants live. In such areas, there is often no transportation to school, jobs, and shops. In some places a store with the necessity of life – food – is nowhere to be found.

Yet conventional banks are often reluctant to make loans for such specialized and sometimes risky purposes. Fortunately, in recent years, federally funded nonprofit lending organizations – known officially as community development financial institutions or CDFIs – have moved in to fill the gap in credit for these needs.

CDFIs are engaged in a demanding business. Their customers may be inexperienced in formal banking or have challenging circumstances – such as a recent home foreclosure, the launch of a new and untested business venture, or even the lack of legal citizenship status.

To provide credit in such situations requires that CDFI officers learn about their clients’ situation and craft appropriate solutions. They might have to customize a loan product or provide personal technical assistance. In more extreme cases, CDFI officers may have to seek out and educate people about the benefits of proper credit.

Given the nature of CDFIs’ business, many of them find it difficult to provide credit on a scale large enough to make a visible impact on low-income communities. Low balance-sheets, lack of operating capital, and insufficient revenue streams can prevent CDFIs from increasing lending activities or expanding their service areas geographically.

Successful CDFIs have found that one of the best ways to overcome these obstacles is to collaborate with other CDFIs.

The First Round of PRO Neighborhoods Awards

To jumpstart collaborations among CDFIs, in January 2014 JP Morgan Chase Global Philanthropy Foundation awarded seven CDFI collaborative clusters, including twenty-seven CDFIs doing widely different work in diverse locales. In the first phase of the foundation’s PRO Neighborhoods program (Partnerships for Raising Opportunity in Neighborhoods) these grants totaled $33 million over a three-year period.

Although the grant period has more than a year to run, our initial evaluation shows the awards have had a striking effect both on the ground and on the CDFIs themselves.

The award capital and its leveraged investment have helped CDFIs strengthen their balance sheets immensely. The seven collaborative clusters have so far raised more than $226 million, or almost seven times the original amount, to carry out their community development programs.

CDFI members of the clusters have ramped up scale of production and expanded their reach across new geographies and types of customers. They have also devised new methods of communication and lending practices suited to the oft-neglected needs of low-income clients.

The CDFI clusters have undertaken a remarkably wide variety of endeavors, including lending to small businesses that are minority-owned or in low-income neighborhoods, helping mobile-home owners purchase and manage their communities, increasing the provision of fresh healthy food, aiding and financing the minority and immigrant owners of low-rent apartment buildings in Chicago, and generating equitable transit-oriented development in the poor and working-class Latino neighborhoods of Phoenix.

The process of collaborating itself helped boost the participating CDFIs. By meeting, discussing, and coordinating with one another, leaders and staff members learned about obstacles in the field, ways to mesh business cultures, and best practices to achieve their desired results.

Having made a great impact on low-income communities and numerous CDFIs that serve such communities, the first round of the PRO Neighborhoods awards has demonstrated that funding CDFI collaborations can be an effective way to support a wide array of underserved populations. Furthermore, the awards is project has helped to lay the foundations for the growth of these CDFIs that will allow them to expand their programs into the future.

Friday, November 20, 2015

Democracy and the Challenge of Affordability: Preserving the Affordable Housing Stock in New York City

Adam Tanaka
JCHS Meyer Fellow
This post is cross posted from a series that our colleagues at the Ash Center for Democratic Governance and Innovation are doing on affordable housing as a challenge to the health of American democracy, and in particular local democracy in the United States. The series, edited by Harvard Kennedy School Assistant Professor Quinton Mayne, is part of the Ash Center’s Challenges to Democracy series, a two-year public dialogue inviting leaders in thought and practice to name our greatest challenges and explore promising solutions.

As part of this series, Adam Tanaka explored the ways in which housing shortages in expensive global cities are leading to a redefinition of affordability, both for low- and middle-income residents. Population and productivity growth, coupled with increasing income inequality, is contributing to a pressure-cooker housing market in which supply is falling far short of demand. As a result, public authorities are finding new ways to partner with private developers to try and meet demand for below-market housing. Tanaka sat down with private developers who are playing an important and telling role in the delivery and management of affordable housing.

For this interview in the series, Tanaka traveled to New York City to interview Rick Gropper of L+M Development Partners, a private affordable housing development company with thirty years of experience in New York. Their conversation reveals some of the political challenges still facing developers operating in this field, as well as new opportunities for innovation across the public-private divide.


New York City has a long tradition of innovation in affordable housing. From building the country’s first public housing project, to establishing its longest-running program of rent control, to experimenting with tax credits that influenced the adoption of the federal Low Income Housing Tax Credit, the city has a strong legacy of public intervention in the housing market.
New York cannot rest on its laurels, however, as a number of trends continue to threaten the city’s affordability. Most obviously, the city’s population is growing, adding considerable stress to the housing stock. Following dramatic population decline and widespread abandonment in the 1970s, the city has rebounded, reaching an all-time high of 8.5 million residents in 2014. The city’s housing market, however, has failed to keep pace, with a shortage of new development driving up housing costs to the point that the median sales price of a home in Manhattan is just shy of $1 million. A surge in foreign investment has added further stress to the system, as a growing number of condominiums sit empty, purchased as assets rather than homes. As the real estate market surges, the “funding gap” between market and affordable rents grows, requiring ever larger subsidies to develop new affordable homes.

In theory, the city’s existing affordable housing stock is supposed to be unaffected by these market trends. Programs like public housing, rent control, and Section 8 vouchers were purpose-built to protect low-income families from a housing market out of their reach, providing long-term affordability through a variety of methods. In reality, however, a number of programmatic impediments have begun to erode the city’s affordable housing stock. This includes the expiration of affordability requirements for many housing developments built in the 1970s and 1980s as well as the removal of units from rent regulation through a technicality known as “luxury decontrol.” It is estimated that over the course of Mayor Bill de Blasio’s first term in office, 45,000 housing units will exit affordability, allowing landlords to charge market-rate rents for the first time if no new subsidies are put in place.

Even public housing—owned and operated by the public sector and thus theoretically the most secure form of affordable housing—is threatened by an increasing lack of federal money for both daily operations and long-overdue capital improvements. As the country’s largest housing authority, the New York City Housing Authority (NYCHA) has been particularly hard-hit by this federal shortfall. In 2014, the agency suffered from a $77 million budget deficit and had estimated capital needs totaling $18 billion, mostly in structural improvements to buildings, many of which are over fifty years old. As such, NYCHA officials are actively exploring new ways to generate revenues for the agency and close the funding gap. One strategy is to lease under-utilized land adjacent to public housing to private developers for new construction. Another is to restructure the funding for public housing to tap new federal sources such as the Rental Assistance Demonstration program.

A third method, which this interview explores in detail, involves the Housing Authority partnering with for-profit developers to access both private capital and federal funds only available to private applicants. In February 2015, NYCHA formed a public-private partnership with two private development companies, L+M Development Partners and BFC Partners, to revitalize a particularly distressed subset of its portfolio: six project-based Section 8 developments housing over 2,000 residents across the Bronx, Manhattan, and Brooklyn. The project-based Section 8 program, initiated in the early 1970s by the Nixon administration, was an operating subsidy mostly intended for use by private developers. However, a number of Section 8 developments fell into the housing authority’s portfolio during the city’s fiscal crisis in the mid-1970s, when NYCHA was better capitalized than the city itself.

Queensbridge Houses, largest public housing development in US (source).

Now that this situation has reversed, NYCHA is exploring new ways to generate revenues not only for its Section 8 projects, but also for its general portfolio. Transferring 50% ownership of these developments to private hands opens the door to tax-exempt bond financing and tax credits, sources generally unavailable to housing authorities. The private partners, meanwhile, benefit from Mark-Up-To-Market contracts from the Department of Housing and Urban Development (HUD), which compensate landlords for the difference between 30% of tenant incomes and market rents.

Of course, even this partial privatization of public housing has generated substantial controversy amongst tenants, local politicians, and housing advocates. To learn more about the politics behind this proposed deal, the Ash Center spoke to Rick Gropper at L+M Development Partners. One of the city’s foremost private affordable housing development companies, L+M’s evolution over the past thirty years epitomizes the growing professionalization of the sector as a whole. The conversation with Gropper reveals some of the political challenges still facing developers operating in this field, as well as new opportunities for innovation across the public-private divide.


Adam Tanaka: Could you describe L+M’s position within the affordable housing landscape in New York City?

Rick Gropper: L+M has been around for about thirty years. The first projects that we did were under the Vacant Building Program, where the city acquired buildings that were in tax foreclosure. These buildings were vacant, and many of them were shells. The city then transferred them to private developers for a dollar. Prospective owners would bid down the rents. One would say: “I can do this job and I’ll charge the residents $500 a month.” Another would say: “I can do $450 a month.” Whoever came up with the financial structure that charged the least rent would get the building.

Then the Tax Act of 1986 introduced a new financial mechanism, the Low Income Housing Tax Credit (LIHTC). The founders of L+M figured out how to syndicate tax credits and place tax-exempt bonds, and they used that financing to charge residents even less for rent. That was the genesis of L+M, working with city and state agencies to gut-renovate buildings across the city.

As the affordable housing industry matured, the company moved to new construction, working with the city to subsidize projects on city-owned land. The city had a lot of land because they had demolished buildings for a variety of reasons. The Department of Housing Preservation and Development, the city’s housing agency, would offer different development sites for a dollar, and would then work with the developer to figure out how to finance them, whether it’s tax-exempt bonds or tax credits or subsidy, or some combination of all three. From the mid-1990s until today, L+M has been predominantly a developer of new affordable housing. We’ve slowly gotten into some other things, such as new construction of market-rate buildings, but most of our work is affordable housing.

There’s been a lot of media attention recently on the expiration of various affordable housing programs. Has L+M been involved in the refinancing of housing developments to enhance their affordability?

Five or six years ago, a lot of the housing stock that was developed in the late 1980s and early 1990s hit what’s known as the “Year 15,” which is the end of the tax credit compliance period. When you’re working with Low Income Housing Tax Credits, they’re delivered to the owner over a 10-year period, and there’s a 15-year compliance period. Once that compliance period ends, you can actually re-syndicate the tax credit properties. When you re-syndicate, you extend the affordability for another 15 years. We have worked to extend affordability in a number of areas facing market pressures, such as Harlem, the East Village, Bushwick and Clinton Hill. When you re-syndicate a building, you might put $40,000 into a unit for renovation, replacing roofs, common areas, boilers, systems and technology changes over time. Being able to re-syndicate and renovate is really important.

What factors do you think drove the city to start relying on the private sector for affordable housing?

For a long time, the city used to build and finance new housing. That ended in the 1970s. Now it’s very expensive for city agencies to build buildings. That’s just not necessarily what they’re good at. When the private sector was brought in, the city realized that they could get more housing built, do it more efficiently and cost-effectively, and create units much more rapidly than they could on their own. That said, it’s always a push and pull with the city. As a private-sector developer, we’re making money on developer fees and cash flow, and the optics of that can be a challenge, politically, for the city. People are wondering, “Why are these private developers making money off of the city?” In reality, we’re building buildings more effectively and efficiently than the city would be able to do on their own. If it develops a project, the city has to do it subject to all the public work rules that apply, which drives up costs and timelines. In the private sector, we have an outstanding record of delivering buildings on time, on budget, and safely.

With an increasing erosion of federal funding for public housing, do you see housing authorities operating in a more entrepreneurial manner?

Housing authorities are already operating in a more entrepreneurial manner, and that started at least five years ago, with the Rental Assistance Demonstration Program (RAD). That program, initiated by the Department of Housing and Urban Development (HUD), enabled housing authorities to bring in private partners if they wanted to, or even finance buildings on their own. With public housing contracts, it’s very difficult, if not impossible, statutorily, to put debt on buildings. That’s a real challenge for NYCHA, which has 170,000 units in various stages of disrepair and about $18 billion of deferred maintenance. The only way that they’re going to generate enough capital to renovate the buildings to a more sustainable standard is to partner with the private sector and to use programs like RAD so that they can finance their own buildings, generate capital, and reinvest either directly back into the building they financed, or into their portfolio.

What stakeholders influenced the outcome of your joint partnership with NYCHA? Did any political dynamic inform the outcome of the deal?

Whenever NYCHA partners with the private sector, there are a host of stakeholders who become very skeptical. The mayor was on board and the various housing agencies understood the urgency of the problem. But there was a whole other cohort of stakeholders–residents, elected officials–who needed to be convinced. So NYCHA spent a long time getting those people on board, assuring the residents that there would be no rent increases or evictions. It was an educational and outreach process.


Image of Saratoga Square, one of the developments undergoing partial privatization

The six sites are located in a wide array of neighborhoods. Presumably this makes each project quite unique, not only financially, but also politically. Can you speak to this variation?

Each property is subject to three levels of public involvement. First, the residents and the tenant association (TA) president. Then the local councilperson. From there, you have the bigger picture: the chair of the Public Housing Committee of City Council, the Committee itself, and the Speaker. So in each case, there were different concerns. The residents’ concerns were related to the specific building. The elected official’s concerns related to the specific climate of the City Council district. And then, on a broader scale, the City Council committee raised issues on transparency, long-term affordability and so forth.

In the East Village, at a property named Campos, it was a challenge to get the local elected official on board, while residents and resident leaders were in support of the deal. There’s a lot of development going on in the neighborhood, and local residents are being displaced. The council-person was skeptical that we might come in and build condos there, even though we can’t do that without NYCHA’s permission. But because of what was happening in that council district, the council-person was very protective. Anything that she could have a say in, she was clamping down on.

Compare that to the property in the Bronx, where we had a TA president who was very skeptical, and a local elected official who was less vocal against the transaction. She knew L+M, knew what we had done in the past, and understood the necessity of the transaction from a security and sustainability perspective. In the Bronx, there was less concern that we were going to convert the buildings to market-rate condos.

Can you explain how NYCHA will benefit from the partnership?

NYCHA will receive a series of payments. They received a partial payment of the purchase price when we closed on the financing of the property. Then when we stabilize the properties and convert to the permanent phase of financing, they’ll receive the rest of the purchase price. They’ll also benefit from a portion of the developer fee and ongoing cash flow. So, NYCHA’s received a big payment up front that they’ve already reinvested into other properties and used to close their budget gap for the first time in many years.

The transaction itself enabled the buildings to be renovated with about $80 million worth of hard cost, and NYCHA to take $250 million in purchase price and put it back into their budget for whatever they see fit. We did that by leveraging the mark-up-to-market HUD contracts, and using debt and tax credit equity to combine into the financial structure for the deal.

From an ongoing perspective, NYCHA will receive half the developer fee and then three quarters of the cash flow. There’s also a seller’s note that they will be paid on. So there are a number of different buckets of proceeds that NYCHA will receive, and they’ll be able to use it however they wish.

What kinds of “reasonable cause” can NYCHA cite to cancel the contract with L+M and BFC? And what is the nature of the 30-year opt-out clause governing the buildings?

NYCHA has a number of different rights in the joint venture. They are the ultimate decision-makers in basically everything. We can’t sell the property; we can’t convert to condos; we can’t really do anything without NYCHA signing off on it. And we have no interest in doing that with these properties. Through the deal we are receiving HUD contracts, which are very valuable and pay market rents. NYCHA has a purchase option in 15 years and can take back the properties if they want to. And then, at the end of the 30-year affordability period, NYCHA is the ultimate decision-maker. They decide what happens at that point. Most likely, we will do a similar transaction and extend the affordability further.

Do you see this deal as providing a clue to the future of affordable housing in New York?

We see this transaction as a model for the potential of public housing. We can generate proceeds that NYCHA can use to reinvest in their portfolio. We renovate their properties and manage them. And we do all of that in a more efficient and effective manner than NYCHA can. It’s a public-private partnership and a real joint venture with NYCHA in which NYCHA has decision-making capability and can leverage the strength of the private sector in terms of what they’re good at doing: building and managing housing.

There’s a way to do that effectively and in a real partnership where the residents feel like their interests are protected, and from our perspective, we’re making money off the property, which gives us an economic incentive to do the right thing and reinvest money into the property and operate it well. As the property does better, we do better.

Adam Tanaka is a Ph.D. student in urban planning at the Harvard Graduate School of Design and a Meyer Fellow at Harvard’s Joint Center for Housing Studies. His research focuses on housing policy and development in the contemporary United States, drawing from the fields of political science, law, urban planning, and real estate to develop methods for understanding and improving urban housing provision.

Many thanks to Jessica Yager at the Furman Center for Real Estate and Urban Policy for helping to arrange the interview.

Read more in the Challenges to Democracy series, including Adam Tanaka's posts.

Read the opening post to this series, which we cross-posted in April 2015.

Friday, November 6, 2015

Can Demolitions and Property Rehabilitations Alter Nearby Crime Patterns?

Senior Research
Associate
The potential for vacant and abandoned structures to attract crime has long concerned local policymakers. Newly vacant structures may attract crime, to the extent that they contain appliances, copper pipes, or other targets for burglary and theft. Additionally, abandoned structures offer suitable locations for criminal activity away from the public eye, such as public order offenses like vandalism or drug use. The presence of such crimes can reduce public safety for other neighborhood residents and require public dollars to police.

The foreclosure crisis sparked increased anxiety about these issues in many communities where concentrated foreclosures left properties vacant. Indeed, a large and growing body of research indicates that foreclosures caused increased crime during this period, largely as a result of the vacancies that occurred during the foreclosure process. In addition to the possibilities mentioned above, researchers hypothesized that foreclosures might increase crime through several additional channels: falling property values might reduce the local resources available for crime prevention; turnover of neighborhood residents might reduce the extent of monitoring in public spaces; and, reduced maintenance might alter offenders’ perceptions about whether the unit is occupied.

These potential vectors for increased crime raise important questions about what options are available to policymakers who seek to prevent vacant properties from becoming sources of blight to their surrounding communities. A recent Joint Center for Housing Studies working paper examines one possible strategy, measuring the extent to which demolitions and property rehabilitations effectively reduced the incidence of crime on or near foreclosed and vacant properties. Specifically, this paper measures the impacts of demolitions and property rehabilitations funded by the Neighborhood Stabilization Program between 2009 and 2013 in Cleveland, Chicago, and Denver. For more information about the Neighborhood Stabilization Program, additional analyses are available here, here, and here.

These three maps below show the location of demolitions and property rehabilitations in Cleveland, Chicago, and Denver. The number, type, and location of NSP activities are displayed, overlaying this information with shading that illustrates the underlying rates of crime in the neighborhoods surrounding the property demolitions and rehabilitations. The working paper measures the average impact of demolitions and property rehabilitations on the incidence of crime that occurs on the property or within 250 feet in any direction. This distance increment reflects the impact of these investments on the property itself or in the areas immediately adjacent to the property (relative to the trend observed in other areas of the neighborhood).

In addition, the map for Denver shows a small number of financing activities which provided down payment assistance to low-income homebuyers to purchase homes that had recently experienced foreclosure. Unfortunately, the number of such properties is too small to allow similar analysis of whether the reoccupancy of these properties affected the incidence of crime or near the financing properties.

https://blogger.googleusercontent.com/img/b/R29vZ2xl/AVvXsEjYylssnfUPVxG_dTqN7b11OP7v9QRo1xRNMG8wSS2GVfIsL5dGuLCyJlYP7Ez-H-xTFQp7znidtDwaqw50Zz4Qr7VaGf1c_Pst7CpI6u1ZT5KauxZDK27B23ICH7l0Nb79pnw6zhAwuZic/s1600/Cleveland+7-29-15+-+same+quartiles.jpg

https://blogger.googleusercontent.com/img/b/R29vZ2xl/AVvXsEh-TqQZYjMlkQhjNabgzso0QbCnJS3BvB9H_yLVUDeEGvD4mG8l05exC0nei7oIH8vY6veuFFSGCIfMNyzA6sK_WPgvbNI1sRZb08JYnUlP1eEfNc3Sm7cwhtdGwnFrxN7FZ2VW-r7829jD/s1600/Chicago+7-29-15+-+same+quartiles.jpg 

https://blogger.googleusercontent.com/img/b/R29vZ2xl/AVvXsEiYW-dZ8nhG1TJIO4kORaEqh_DxqoTMtDNxvWM7YcSPr8vDkC5nIdTqBMmoAyRmR2EAaGf9KvNv4aXRa7R5ql91xlNUEhlCxsKoZ0bS0Ri9c-L3Xo_pYqXBzheWc8cuKFgR7sZ14qWkzxjy/s1600/Denver+7-29-15+-+same+quartiles.jpg

The results suggest that the demolitions conducted by the NSP grantee in Cleveland reduced the incidence of burglary and theft within 250 feet of the demolished properties. The measured impacts of demolitions were present during the period of the demolition and persisted for one year following the demolition, before dissipating. In total, these estimates imply a reduction of just over 1 reported property crime for every 2 demolitions completed.

The findings do not show similar impacts for the observed set of property rehabilitations in Cleveland, Chicago, and Denver, nor for the observed set of demolitions in Chicago. Because the sample sizes are much smaller for these activities, we are unable to determine whether these activities had no impact on crime, or whether this outcome is due to limitations of the study’s data and methods. For example, the set of property rehabilitations conducted in each city, as well as the set of demolitions in Chicago, each included a heterogeneous set of property  and neighborhood types, which may limit the estimates of the ‘average effect’ of these investments.

Nonetheless, the findings carry useful implications about the potential for demolitions to alter nearby crime patterns. The direct implication is that a strategy of concentrated demolitions may be effective in altering neighborhood crime patterns under certain conditions. The map of Cleveland above illustrates the extent to which Cleveland clustered its demolition activity, targeting its demolitions primarily to neighborhoods with high levels of vacancy and abandonment. The reductions in crime surrounding these demolitions add to the potential benefits that policymakers should consider in weighing the use of demolition to remove vacant and abandoned properties. The caveat is that the size of the impacts is relatively modest. Policymakers will need to weigh the overall benefits of demolishing vacant and abandoned structures against the costs—which averaged $13,970 per demolition for the NSP program.

Some caution is also needed in applying the findings to other neighborhoods and cities. As the above discussion suggests, the estimates reflect Cleveland’s use of concentrated demolitions in neighborhoods with high levels of vacancy and abandonment and moderate levels of crime. Their demolition strategy might therefore be readily applied to nearby Midwestern cities facing similar challenges, but could be less exportable to neighborhoods with different levels of crime, different built environments, or that are located in different regions of the United States.

Friday, October 23, 2015

Variable Population Growth is Driving an Uneven Housing Recovery in the Nation’s Large Metropolitan Areas

by George Masnick
Senior Research Fellow
We easily accept the proposition that the housing recovery will be greatest in parts of the country where population growth and job growth are occurring more rapidly. But we often forget that the longer-term trends in population growth that drive housing demand are not only highly variable across metropolitan areas, but also tend to be persistent over time within metros. Places leading the housing recovery are the same places where the engines of population growth have had the greatest long-term sustained horsepower. These are places where the young adult population is growing most rapidly. Such places have younger age structures because they are destinations for both international and domestic migration, and their younger age structures sustain population growth from higher natural increase as well. Slow growth metros, where the demand for new housing is lower, are generally places with older age structures and a lack of net in-migration – places where these variables are not likely to change in a fundamental way in the foreseeable future. That being said, there have been changes in population growth among the nation’s large metros since the end of the Great Recession that are worth noting. Metros that have grown more slowly since before 2010 are still trying to put the effects of the economic downturn behind them. Metros that have higher population growth 2010-2014 are generally those where rising housing prices and rents have squeezed household budgets most severely.

The latest release of Census Bureau 2014 population estimates for metropolitan areas underscores the existence of large differences in population growth among the nation’s large metros. The nation’s 100 largest metropolitan areas in 2014 are home to about two thirds of Americans. The largest of these is the New York-Northern New Jersey-Long Island metro at just over 20 million, and the smallest is Durham-Chapel Hill at about 550,000. If we compare population growth that took place during the first decade of this century with what has occurred more recently, we can see both the longer-term growth differences among metros and identify places where population growth has accelerated or declined between 2010 and 2014.

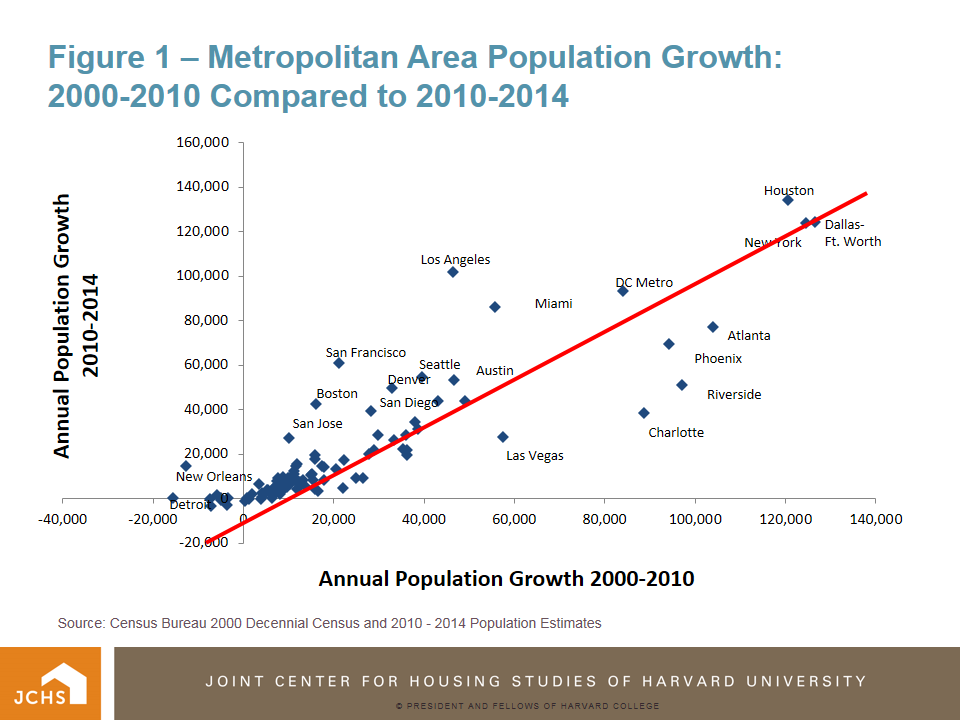
Figure 1 plots annual population growth in the 97 of the 100 largest metro areas in 2010 that also made this list in 2014. Most of the 97 metros cluster together at under 25,000 annual population growth for both periods, and are growing moderately, slowly, or not at all. Only a couple of dozen metros exhibit population growth that sets them apart. For these, the higher the population growth in 2000-2010, the higher the growth in 2010-2014. For example, the Houston-Sugarland-Baytown metro area added an average of 123,000 people per year in the decade 2000-2010 and 134,000 per year from 2010 to 2014. Dallas-Fort Worth-Arlington increased 126,000 annually during the 2000s and 124,000 annually so far this decade. New York-Northern New Jersey-Long Island grew at an annual rate of 124,000 during each period.

https://blogger.googleusercontent.com/img/b/R29vZ2xl/AVvXsEgYADZ5qn8CPCuBSAVXqeUbrWBTtrxZ7ShDBsOD1PHFC8HRiVTrC5il4H2QF25Z35Y0XQS4feWy8GhayVXhr-YFAjw77cpdYfxdCTIbdgUT-cgYEDXU2SJsr_77G7ZM-AHFMPR5SqW8DkMa/s1600/Masnick_fig1.PNG

The diagonal red line separates the scatterplot into metros that grew at a faster numerical annual rate during 2010-2014 compared to 2000-2010 (above the line) from those that grew more slowly (below the line). Among other moderately-higher growth metros, Atlanta-Sandy Springs-Marietta, Phoenix-Mesa-Scottsdale, Riverside-San Bernardino-Ontario, and Las Vegas-Paradise have grown more slowly since 2010, while Los Angeles-Long Beach-Santa Ana, the DC-VA-MD-WV metro, and Miami-Fort Lauderdale-West Palm Beach have grown more rapidly. Some metros with moderate growth during the previous decade have begun to grow more rapidly and add 30,000 or more people per year during the first half of the current decade. In addition to San Francisco-Oakland-Hayward and Boston-Cambridge-Quincy, Seattle-Tacoma-Belleview, Denver-Aurora-Lakewood, San Jose-Sunnyvale-Santa Clara and San Diego-Carlsbad are on this list of metros with significantly increased population growth. These are also places with the greatest increases in housing prices.

The Charlotte-Gastonia-Concord metropolitan area is an outlier in how much slower its population has grown in the recent period compared to 2000-2010. Such a slowdown should be surprising since Charlotte was not hit by the Great Recession and the bursting of the housing bubble as much as other metros falling well below the red line in Figure 1. In fact, its faster growth during 2000-2010 stems primarily from a large (+26%) adjustment to its baseline 2010 census count. It is the only metro in the top 100 with such a large percentage adjustment, which the Census Bureau states could be "due to legal boundary updates, other geographic program changes, and Count Question Resolution action."

Decomposing population growth into its two broad components, net migration and natural increase (excess of births over deaths), allows us to better understand these recent metropolitan population growth trends. Figure 2 shows that the greater the net migration the greater the natural increase. Since migrants are generally young adults, metros that are migrant destinations have a greater excess of births over deaths. This is especially true of metros like Houston-Sugarland-Baytown, Dallas-Fort Worth-Arlington, DC-VA-MD-WV and Atlanta-Sandy Springs-Marietta, where both domestic and international migration are strongly positive (Table 1). Places that are retirement destinations like Miami-Fort Lauderdale-West Palm Beach, Orlando-Kissimmee-Sanford, and especially Tampa-St. Petersburg-Clearwater, have much lower rates of natural increase (fewer births and more deaths) because of their older age structures.
https://blogger.googleusercontent.com/img/b/R29vZ2xl/AVvXsEhFeK4nTXZKN_TMCTkJIwRnktTNPc60bGU5m002VytkYwMpKLE2TdQio1nxeJ8B1sbl0Tj0QQLcBN5Ec4qr-R4Vx-iu7c3WX5YebDw5o0ERH24B8_dTr_VlJmsNFl6T-5NITGQqUtgSC6V3/s1600/Masnick_fig2.PNG

New York-Northern New Jersey-Long Island is an outlier, with its high level of international immigration largely being offset by domestic outmigration (annually 141,000 and -124,000 respectively during 2010-2014). But the New York metro’s high share of minority population (50.2 percent according to the 2010 census) produces a large growth from natural increase because of younger age structure and above-replacement fertility for minorities. Los Angeles-Long Beach-Santa Ana’s profile is similar to New York’s in that levels of recent annual international in-migration are offset by high levels of domestic migration losses (62,000 and -49,000 respectively), and its high natural increase is fueled by its minority population (67.6 percent in 2010). The Chicago-Naperville-Elgin metro area has recently experienced more than twice the level of domestic out-migration than immigration according to Census Bureau estimates. Still, Chicago’s minority population (46 percent in 2010) produces a significant level of natural increase, which has kept the Chicago metro’s overall population growth positive.

https://blogger.googleusercontent.com/img/b/R29vZ2xl/AVvXsEiNSPjt3PUBUGl6NAxXIn_1KullPPkQOvey0Mno2E3AUA43Ldt67saXAu9qe6qwxF2LIU9oIZdO57PEIvWKJSfOAfneqKVuzAnKOdXUKawulZ2F6fujbzZLWrFI8rnpGWAU9tZV50RJu9XE/s1600/Masnick_table1.PNG

Population age structure and percent minority are demographic characteristics that change little from year to year, and these are the characteristics that largely determine growth from natural increase. Places with high natural increase should continue to produce and excess of births over deaths. Looking forward, unless patterns of domestic or international migration change dramatically in the short run, high-growth metros should remain high and low-growth metros remain low.