Showing posts with label rehabilitation. Show all posts

Thursday, November 30, 2017

Rebuilding from 2017's Natural Disasters: When, For What, and How Much?

by Kermit Baker and
Alexander Hermann
The bulk of repairs to homes damaged by this year's record-setting disasters will not be done until 2019 or 2020, according to our analysis of post-disaster spending between 1994 and 2015. The analysis, which looked at the estimated annual cost of natural disasters alongside annual estimates of disaster-related home repairs and improvements, suggests that an increase of $10 billion in total disaster losses any time in the previous three years is associated with about $300 million in additional annual spending on disaster-related home repairs and improvements.

Notes: Dollar values are adjusted for inflation using the CPI-U for all items. Natural disaster costs include only natural disasters that generate over $1 billion in damages after adjusting for inflation.
Sources: JCHS tabulation of US Housing and Urban Development, American Housing Survey, and National Oceanic and Atmospheric Administration data.


The finding is significant because 2017 was an unusually destructive year. While inflation-adjusted, disaster-related damages averaged about $40 billion a year between 1994 and 2015, Hurricanes Harvey, Irma, and Maria together caused about $150 billion in damages, according to estimates from CoreLogic and Moody’s Analytics (Figure 1). Moreover, damages from 2017’s winter storms, droughts, and wildfires will push these numbers even higher. In fact, the total cost of 2017’s disasters could exceed damages from any year in the last two decades, including 2005, the previous record year, when Hurricanes Katrina and Rita (and a host of smaller but significant disasters) combined to cause more than $200 billion in damages (in inflation-adjusted dollars).

As in other years that were marked by particularly destructive storms and other disasters, this year’s damages should lead to a spurt in construction activity. Some of it will be construction of and renovations to infrastructure and commercial buildings. Some will be the construction of new single-family homes and multifamily housing units. And some will be disaster-related repairs and improvements to both owner-occupied and rental housing.

Extensive flooding from Hurricane Harvey in Port Arthur, Texas.

To estimate how much will be spent on post-disaster home repairs, and when that spending is likely to occur, we combined information on disaster-related damages reported by the National Oceanic and Atmospheric Administration (NOAA) with data on disaster-related home repairs and improvements for the same years found in the U.S. Census Bureau’s American Housing Survey (AHS). The AHS, as a survey of households, only asks owners to report spending on their homes. The comparison suggests that renovation spending continues to increase for about two to three years after the natural disaster occurs, and that an increase of $10 billion in disaster losses any time over the prior three years generates about $300 million in additional disaster-related home improvement spending during the year studied. If this pattern holds, the bulk of the spending from 2017 losses won’t occur until 2019 or 2020. But when it occurs, there is likely to be a substantial increase in spending on home renovations in those years.

While the delay between disaster losses and repair expenditures may seem unusually lengthy, it is consistent with a study funded by the U.S. Department of Housing and Urban Development (HUD) that examined the rebuilding that took place following Hurricanes Katrina and Rita. In a recent Joint Center blog on that study’s implications, our colleague Jonathan Spader (who worked on the initial HUD study) reported that only 70 percent of hurricane-damaged properties in Louisiana and Mississippi had been rebuilt by early 2010, five years after the storms. The study further found that 74 percent of owner-occupied homes had been rebuilt, compared to only 60 percent of the rental properties.

The delays are due to many factors. Insurance companies need to assess the extent of the damage and determine how much is covered. Home improvement contractors, stretched to the limit and suffering from a labor squeeze, must delay certain projects. Owners have to consider local housing and labor market conditions to determine if repairs or improvements make financial sense. Often, federal, state, and local government entities may slow down rebuilding while they decide whether it’s feasible and, if so, whether building codes and insurance guidelines should be more stringent.

Nevertheless, spending will occur and, when it does, it can be substantial. Illustratively, in 2015 (which came after a few relatively mild years for disasters) spending on disaster-related home renovations accounted for almost $11 billion of the $220 billion spent nationally improving owner-occupied homes according to the 2015 AHS. (Lightning and fires accounted for $2.4 billion of this spending, floods for $2.0 billion, and tornados and hurricanes for $1.6 billion. Winter storms, thunderstorms, earthquakes, and drought accounted for the remainder.)

In short, 2017’s hurricanes and other disasters are likely to result in substantial spending on rebuilding, repairs, and improvements to disaster-damaged homes. Moreover, while that spending will ramp up slowly, it is likely to stretch into next decade.

Friday, November 6, 2015

Can Demolitions and Property Rehabilitations Alter Nearby Crime Patterns?

Senior Research
Associate
The potential for vacant and abandoned structures to attract crime has long concerned local policymakers. Newly vacant structures may attract crime, to the extent that they contain appliances, copper pipes, or other targets for burglary and theft. Additionally, abandoned structures offer suitable locations for criminal activity away from the public eye, such as public order offenses like vandalism or drug use. The presence of such crimes can reduce public safety for other neighborhood residents and require public dollars to police.

The foreclosure crisis sparked increased anxiety about these issues in many communities where concentrated foreclosures left properties vacant. Indeed, a large and growing body of research indicates that foreclosures caused increased crime during this period, largely as a result of the vacancies that occurred during the foreclosure process. In addition to the possibilities mentioned above, researchers hypothesized that foreclosures might increase crime through several additional channels: falling property values might reduce the local resources available for crime prevention; turnover of neighborhood residents might reduce the extent of monitoring in public spaces; and, reduced maintenance might alter offenders’ perceptions about whether the unit is occupied.

These potential vectors for increased crime raise important questions about what options are available to policymakers who seek to prevent vacant properties from becoming sources of blight to their surrounding communities. A recent Joint Center for Housing Studies working paper examines one possible strategy, measuring the extent to which demolitions and property rehabilitations effectively reduced the incidence of crime on or near foreclosed and vacant properties. Specifically, this paper measures the impacts of demolitions and property rehabilitations funded by the Neighborhood Stabilization Program between 2009 and 2013 in Cleveland, Chicago, and Denver. For more information about the Neighborhood Stabilization Program, additional analyses are available here, here, and here.

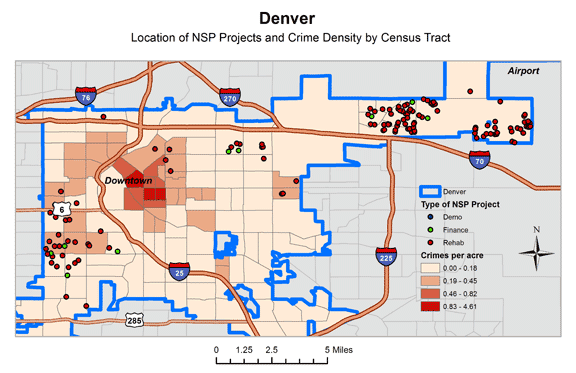
These three maps below show the location of demolitions and property rehabilitations in Cleveland, Chicago, and Denver. The number, type, and location of NSP activities are displayed, overlaying this information with shading that illustrates the underlying rates of crime in the neighborhoods surrounding the property demolitions and rehabilitations. The working paper measures the average impact of demolitions and property rehabilitations on the incidence of crime that occurs on the property or within 250 feet in any direction. This distance increment reflects the impact of these investments on the property itself or in the areas immediately adjacent to the property (relative to the trend observed in other areas of the neighborhood).

In addition, the map for Denver shows a small number of financing activities which provided down payment assistance to low-income homebuyers to purchase homes that had recently experienced foreclosure. Unfortunately, the number of such properties is too small to allow similar analysis of whether the reoccupancy of these properties affected the incidence of crime or near the financing properties.

https://blogger.googleusercontent.com/img/b/R29vZ2xl/AVvXsEjYylssnfUPVxG_dTqN7b11OP7v9QRo1xRNMG8wSS2GVfIsL5dGuLCyJlYP7Ez-H-xTFQp7znidtDwaqw50Zz4Qr7VaGf1c_Pst7CpI6u1ZT5KauxZDK27B23ICH7l0Nb79pnw6zhAwuZic/s1600/Cleveland+7-29-15+-+same+quartiles.jpg

https://blogger.googleusercontent.com/img/b/R29vZ2xl/AVvXsEh-TqQZYjMlkQhjNabgzso0QbCnJS3BvB9H_yLVUDeEGvD4mG8l05exC0nei7oIH8vY6veuFFSGCIfMNyzA6sK_WPgvbNI1sRZb08JYnUlP1eEfNc3Sm7cwhtdGwnFrxN7FZ2VW-r7829jD/s1600/Chicago+7-29-15+-+same+quartiles.jpg 

https://blogger.googleusercontent.com/img/b/R29vZ2xl/AVvXsEiYW-dZ8nhG1TJIO4kORaEqh_DxqoTMtDNxvWM7YcSPr8vDkC5nIdTqBMmoAyRmR2EAaGf9KvNv4aXRa7R5ql91xlNUEhlCxsKoZ0bS0Ri9c-L3Xo_pYqXBzheWc8cuKFgR7sZ14qWkzxjy/s1600/Denver+7-29-15+-+same+quartiles.jpg

The results suggest that the demolitions conducted by the NSP grantee in Cleveland reduced the incidence of burglary and theft within 250 feet of the demolished properties. The measured impacts of demolitions were present during the period of the demolition and persisted for one year following the demolition, before dissipating. In total, these estimates imply a reduction of just over 1 reported property crime for every 2 demolitions completed.

The findings do not show similar impacts for the observed set of property rehabilitations in Cleveland, Chicago, and Denver, nor for the observed set of demolitions in Chicago. Because the sample sizes are much smaller for these activities, we are unable to determine whether these activities had no impact on crime, or whether this outcome is due to limitations of the study’s data and methods. For example, the set of property rehabilitations conducted in each city, as well as the set of demolitions in Chicago, each included a heterogeneous set of property  and neighborhood types, which may limit the estimates of the ‘average effect’ of these investments.

Nonetheless, the findings carry useful implications about the potential for demolitions to alter nearby crime patterns. The direct implication is that a strategy of concentrated demolitions may be effective in altering neighborhood crime patterns under certain conditions. The map of Cleveland above illustrates the extent to which Cleveland clustered its demolition activity, targeting its demolitions primarily to neighborhoods with high levels of vacancy and abandonment. The reductions in crime surrounding these demolitions add to the potential benefits that policymakers should consider in weighing the use of demolition to remove vacant and abandoned properties. The caveat is that the size of the impacts is relatively modest. Policymakers will need to weigh the overall benefits of demolishing vacant and abandoned structures against the costs—which averaged $13,970 per demolition for the NSP program.

Some caution is also needed in applying the findings to other neighborhoods and cities. As the above discussion suggests, the estimates reflect Cleveland’s use of concentrated demolitions in neighborhoods with high levels of vacancy and abandonment and moderate levels of crime. Their demolition strategy might therefore be readily applied to nearby Midwestern cities facing similar challenges, but could be less exportable to neighborhoods with different levels of crime, different built environments, or that are located in different regions of the United States.