Friday, August 25, 2017

Managing Rapid Urbanization: Lessons from Mongolia

by David Luberoff
Senior Associate
Director
The capital city of Mongolia, Ulaanbaatar, provides a useful lens for understanding tensions that arise from rapid urbanization, according to two recent journal articles reporting on research funded in part by the Joint Center's Student Research Support Program.

In the first piece, which appeared in International Planning and Development Review, Raven Anderson (formerly a research fellow in the Social Agency Lab at the Harvard Graduate School of Design) and Michael Hooper (an associate professor of urban planning at the GSD) explain that because of an economic boom, a series of harsh winters, and the decline of the rural economy, Ulaanbaatar grew dramatically over the last two decades. In response, a diverse array of domestic and international organizations converged on the city to help address the environmental, spatial, and social challenges created by the rapid growth.

Anderson and Hooper, interviewed representatives from 18 of these organizations and learned that while there is agreement about the city's main challenges there is a lack of consensus about how to tackle them. The result, they note, was a "proliferation of plans, in which local organizations' perspectives are often given relatively little attention."

In the second article, which appeared in the Journal of Urbanism, Anderson, Hooper, and Allie Aldarsaikhan Tuvshinbat (also a former researcher at the Social Agency Lab) use interviews with about 120 residents to explore some of the differing perspectives. They found that while there were relatively high levels of support for increases in unit-level density and for apartment living, the majority of interviewees also favored low land-use density.

The tension between the two findings, they note, is "a central theme in the results. The limited appeal of high-density land use likely reflects Mongolian cultural attitudes towards land and open space. These attitudes are generally not reflected in the global 'compact city' models that are promoted by international organizations and which appear to be driving the current city masterplan and other formal planning efforts in the city."

The divergence between residents' views and the organizations' desires, note Anderson and Hooper in the first article, "is likely to further reduce the city's ability to effectively cope with rapid urban growth."

Friday, August 18, 2017

Who Owns Rental Properties, and is it Changing?

by Hyojung Lee
Postdoctoral Fellow
Institutional investors own a growing share of the nation's 22.5 million rental properties and a majority of the 47.5 million units contained in those properties, according to the US Department of Housing and Urban Development's recently released 2015 Rental Housing Finance Survey (RHFS), a survey administered by the Census Bureau. The changes are notable because virtually all of the household growth since the financial crisis has occurred in rental units, with more than half of the growth occurring in single-family rental units.

According to the RHFS, individual investors were the biggest group in the rental housing market in 2015, accounting for 74.4 percent, or 16.7 million rental properties, followed by limited liability partnerships (LLPs), limited partnerships (LPs), or limited liability companies (LLCs) (14.8 percent); trustees for estates (4.1 percent); and nonprofit organizations (1.6 percent) (Table 1). However, because the share of rental properties owned by individual investors tends to decrease with the property size, individual investors owned less than half (47.8 percent) of rental units, followed by LLPs, LPs, or LLCs (33.2 percent), trustees for estates (3.3 percent), real estate corporations (3.3 percent), and nonprofit organizations (3.2 percent).


Source: Rental Housing Finance Survey, 2015.

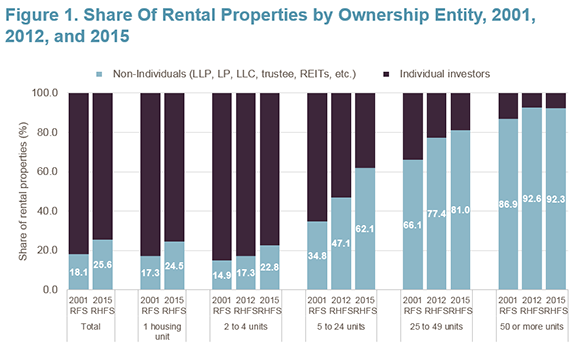
When combined with data from the 2012 RHFS and the 2001 Residential Finance Survey (RFS), the new data also show that the number and share of rental properties owned by institutional investors increased for all types of properties between 2001 and 2015 (Figure 1). For example, while about a third of properties with 5 to 24 units were owned by non-individual investors in 2001, that share soared to 47 percent in 2012 and about two-thirds in 2015. Similarly, about 66.1 percent of properties with 25 to 49 units were owned by institutional entities in 2001, which rose to 77 percent in 2012 and about 81 percent in 2015.


Source: Residential Finance Survey, 2001; Rental Housing Finance Survey, 2012 and 2015.
Note: The condominiums and mobile homes the 2001 RFS were excluded as they are excluded in the 2012 and 2015 RHFS. Single-family units were not counted in the 2012 RHFS.

While individual investors (often called "mom-and-pop landlords") still owned about three-quarters of all single-family rental properties in 2015, the share of those properties owned by institutional investors rose from 17.3 percent in 2001 to 24.5 percent in 2015. However, during this time, many individual landlords reportedly created their own LLCs and transferred ownership of their property to protect themselves from liabilities and take advantage of tax benefits. As a result, the figures for single-family rentals may understate the number of mom-and-pop landlords.

Finally, the 2015 RHFS also provides useful information about when these changes occurred. Overall, non-individual investors accounted for about 16 percent of rental properties acquired from 1980 to 2004. That changed dramatically in the years after the financial crisis. Non-individual investors bought 28 percent of rental properties sold between 2010 and 2012 and 49.3 percent sold between 2013 and 2015 (Figure 2). Moreover, this shift was particularly pronounced for properties with 1 to 4 units (compared to those with 5 or more units).


Source: Rental Housing Finance Survey, 2015.

Despite potential implications for both renters and the broader housing market, there have been relatively few studies assessing the impacts of changing ownership patterns for rental properties. However, some research suggest that the changes are more than just paperwork. Illustratively, a 2016 discussion paper published by the Federal Reserve Bank of Atlanta reported that large corporate landlords and private equity investors of single-family rental homes in Fulton county, Georgia were far more likely to file eviction notices than small landlords in the county. Hopefully, the changes documented in the 2015 RHFS will spur additional research on how ownership patterns affect such key issues as rental affordability, housing instability, and the upkeep of rental units.

Friday, August 11, 2017

Pay for Success: Opportunities and Challenges in Housing and Economic Development

by David Luberoff
Senior Associate
Director
Pay for Success (PFS) initiatives have received widespread attention in the United States over the past several years. These outcomes-based projects – which generally do not pay service providers and government entities until and unless they achieve certain agreed upon outcomes – hold great promise in a variety of fields, including housing and community development, notes Omar Carrillo Tinajero in a new working paper jointly published by NeighborWorks® America and the Joint Center for Housing Studies. In the paper, Carrillo, a 2016 Edward M. Gramlich Fellow, notes that PFS projects may offer important opportunities to break down funding silos, devise innovative new ways to address pressing problems, and compel providers to focus on the results of an intervention. However, he adds, “because their complexity makes them at present difficult to structure and finance, PFS projects are likely to be useful only in limited circumstances, which means the PFS model should therefore be used judiciously and carefully.” Moreover, he notes, “the interest in and discussion about PFS projects has highlighted approaches that could be carried out by the public sector without the structure of PFS arrangements.”

To better understand how this approach could be used to address housing and community development issues, Carrillo examines three projects: 
  • The Denver Supportive Housing Social Impact Bond Initiative, which focused on providing supportive housing for individuals who are both frequently in jail and often go to emergency medical services in Denver.
  • The Chronic Homelessness PFS Initiative, which aims to provide 500 units of permanent supportive housing for up to 800 of the 1,600 people currently experiencing homelessness in Massachusetts.
  • Project Welcome Home, an initiative in Santa Clara County, California focused on providing housing and supportive services for 150-200 chronically homeless individuals in the Silicon Valley over six years.
In the paper, Carrillo reviews the goals of each initiative and describes the metrics that will be used to decide whether and how much providers will be paid.  He also offers detailed descriptions about how each initiative was organized, funded, and evaluated.

The initiatives, he writes, “are promising, especially as they promote an emphasis on outcomes and begin to streamline services from various government sources.” However, he also cautions that “it is not immediately obvious that their benefits outweigh their costs,” particularly the extensive time and resources needed to develop and oversee the initiatives. He adds that it may be possible for the public-sector to adopt many PFS approaches (particularly their focus on outcomes, and the need for better data systems to measure those outcomes) without developing the complex structures and systems needed to establish and oversee an effective PFS.

“Though PFS sounds promising,” he concludes, “putting a project together can entail logistical difficulties and substantial transaction costs. Because of these challenges, the PFS model should be used judiciously. In particular, it could be a promising strategy for situations in which addressing problems requires coordination of a variety of disparate sources of public funding which, for various reasons, are difficult to use in a coordinated fashion.”

However, he adds, “we should not lose sight of the overall problem that PFS programs address: the need to provide services to as many people as possible, in the most effective way possible. It seems difficult to conceive of increased funding for these much-needed resources from the federal government, and state and local governments will continue to find themselves pressed for solutions to deliver evidence-based services. The PFS movement has pushed public-sector entities to focus more heavily on outcomes and, in doing so, to consider more multi-pronged approaches for addressing key issues.”


Monday, August 7, 2017

Significant Improvements in Energy Efficiency Characteristics of the US Housing Stock

by Elizabeth
La Jeunesse

Research Analyst
Compared to 2009, single-family homes built before 1980 are now better insulated, have relatively newer heating equipment, and are more likely to have undergone an energy audit. These and other energy-related characteristics of the owner-occupied stock, shown in Table 1, are consistent with the expanding size of the home improvement industry over the past few years, with particular growth in energy-sensitive projects. Homeowners' annual spending for related projects—including roofing, siding, windows/doors, insulation and HVAC—expanded from $50 billion to nearly $70 billion over 2009-2015.


The transformation of the existing US housing stock toward greater energy efficiency also reflects a wave of energy-related incentives for HVAC and building envelope upgrades put in place following the rise of energy prices in the mid-2000s. At the federal level, one of the biggest initiatives was the Obama administration’s American Recovery and Reinvestment Act of 2009, which extended and strengthened tax credits for energy improvements to existing homes, including insulation, windows, roofs, water heaters, furnaces, boilers, heat pumps, and central air conditioners.

Despite recent progress, there is room for growth. As of 2015, 17 percent of single-family homes built prior to 1980 were still reported to have ‘poor insulation’, and only 11 percent had received an energy audit. By comparison, a recent profile of newly constructed homes (built after 2009) showed only 1 percent of residents reporting ‘poor insulation’—an impressively low share. Moreover, nearly 90 percent of new homes come with double- or triple-pane windows. Bringing older homes up to this higher standard will require significant investments to the existing stock.
At the same time, only 5 percent of new homes have smart thermostats—a relatively inexpensive but potentially high-payoff upgrade—and a similar share have energy-saving tankless water heaters. These lower shares suggest room for growth in energy-efficient technologies in new and old homes alike.
Renewable technologies, particularly solar energy, are also showing signs of growth. As of 2015, nearly 6 percent of recently built homes reported on-site solar generation, a relatively small share, but nearly triple the incidence in older homes. Thanks to the Consolidated Appropriations Act of 2016, US taxpayers can still claim a credit of up to 30 percent of expenditures for photovoltaic and solar thermal technologies placed in service in their homes. Several US states also now provide consumers with credits for net excess energy generation, further increasing the payoff for installing renewable energy systems.
With recent declines in energy prices, however, there is some question of whether homeowners still have strong incentives to pursue energy-efficiency improvements. Since 2015, the consumer price index for energy has hovered around 10 percent below its average for the prior ten years (2005-2014). If this trend continues, further progress in energy-related improvements will probably depend even more on consumer preferences and finances, in addition to changing building and product codes, and evolving industry standards. 
Data used in this analysis comes from a newly released 2015 Energy Information Administration survey that tracks the energy-related characteristics of all US residential units. Further results detailing energy consumption intensity (or usage per square foot) will be released in 2018, enabling deeper analysis into the evolution of energy efficiency in US homes.