 |
| by Hyojung Lee Postdoctoral Fellow |
According to the RHFS, individual investors were the biggest group in the rental housing market in 2015, accounting for 74.4 percent, or 16.7 million rental properties, followed by limited liability partnerships (LLPs), limited partnerships (LPs), or limited liability companies (LLCs) (14.8 percent); trustees for estates (4.1 percent); and nonprofit organizations (1.6 percent) (Table 1). However, because the share of rental properties owned by individual investors tends to decrease with the property size, individual investors owned less than half (47.8 percent) of rental units, followed by LLPs, LPs, or LLCs (33.2 percent), trustees for estates (3.3 percent), real estate corporations (3.3 percent), and nonprofit organizations (3.2 percent).
Source: Rental Housing Finance Survey, 2015.
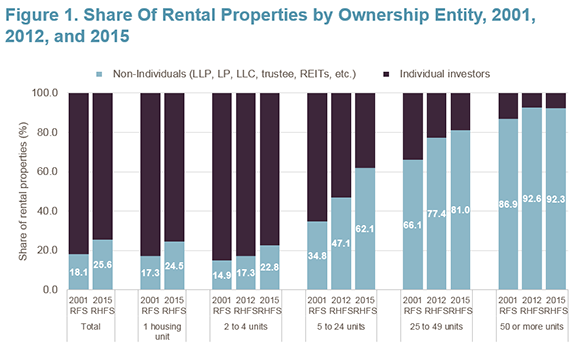
When combined with data from the 2012 RHFS and the 2001 Residential Finance Survey (RFS), the new data also show that the number and share of rental properties owned by institutional investors increased for all types of properties between 2001 and 2015 (Figure 1). For example, while about a third of properties with 5 to 24 units were owned by non-individual investors in 2001, that share soared to 47 percent in 2012 and about two-thirds in 2015. Similarly, about 66.1 percent of properties with 25 to 49 units were owned by institutional entities in 2001, which rose to 77 percent in 2012 and about 81 percent in 2015.
Source: Residential Finance Survey, 2001; Rental Housing Finance Survey, 2012 and 2015.
Note: The condominiums and mobile homes the 2001 RFS were excluded as they are excluded in the 2012 and 2015 RHFS. Single-family units were not counted in the 2012 RHFS.
While individual investors (often called "mom-and-pop landlords") still owned about three-quarters of all single-family rental properties in 2015, the share of those properties owned by institutional investors rose from 17.3 percent in 2001 to 24.5 percent in 2015. However, during this time, many individual landlords reportedly created their own LLCs and transferred ownership of their property to protect themselves from liabilities and take advantage of tax benefits. As a result, the figures for single-family rentals may understate the number of mom-and-pop landlords.
Finally, the 2015 RHFS also provides useful information about when these changes occurred. Overall, non-individual investors accounted for about 16 percent of rental properties acquired from 1980 to 2004. That changed dramatically in the years after the financial crisis. Non-individual investors bought 28 percent of rental properties sold between 2010 and 2012 and 49.3 percent sold between 2013 and 2015 (Figure 2). Moreover, this shift was particularly pronounced for properties with 1 to 4 units (compared to those with 5 or more units).
Source: Rental Housing Finance Survey, 2015.
Despite potential implications for both renters and the broader housing market, there have been relatively few studies assessing the impacts of changing ownership patterns for rental properties. However, some research suggest that the changes are more than just paperwork. Illustratively, a 2016 discussion paper published by the Federal Reserve Bank of Atlanta reported that large corporate landlords and private equity investors of single-family rental homes in Fulton county, Georgia were far more likely to file eviction notices than small landlords in the county. Hopefully, the changes documented in the 2015 RHFS will spur additional research on how ownership patterns affect such key issues as rental affordability, housing instability, and the upkeep of rental units.


No comments:
Post a Comment